iUTAH Team - Undergraduate iFellows
Sawyer Hill
Westminster College
Mentors:
Faculty: Rob Stoll, UU
Faculty: Eric Pardyjak, UU
Graduate: Brian Bailey, UU
Research Focus:
Research Focus Area 3
Major:
Environmental Studies (Science Track)
Biography:
Sawyer Hill grew up in Sandy, UT and is currently an environmental science major and Spanish minor at Westminster College with plans to pursue a degree in environmental engineering after graduation. He enjoys spending his free time playing on an indoor soccer team, camping, hiking, fishing, skiing and spending as much time in the outdoors as possible.
iFellow Presentation
Impact of Urban Environments on the Water and Radiation Budget of Coniferous Trees
Runoff
Presented by: Sawyer Hill
July 2015
Weekly Recap:
Week 1 | Week 2 | Week 3 | Week 4 | Week 5 | Week 6 | Week 7 | Week 8 | Week 9 | Week 10 | Week 11
Week 1: May 18-22, 2015
This week we jumped right into the ongoing LEMS project that is taking place on the engineering quad at the University of Utah. LEMS stands for "Local Energy Measurement Stations" and consist of little yellow boxes attached to big green t-posts with a number of sensors attached which measure everything from air temperature and humidity to wind speed and direction and even soil moisture. The LEMS will remain up for the summer to collect data, which will then be analyzed and modeled.
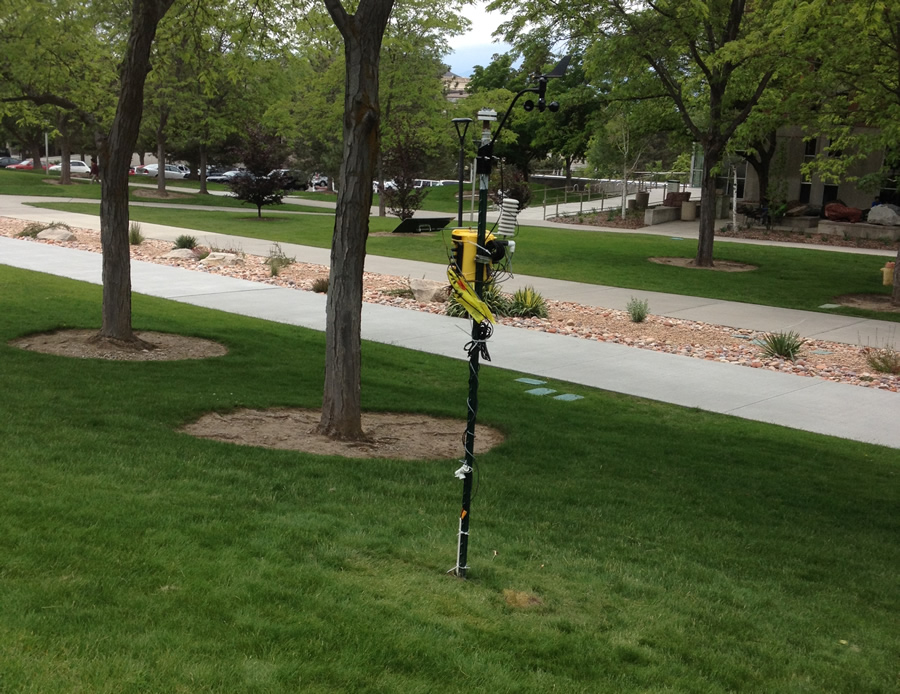
Here is one of the super LEMS (a super LEMS has more sensors than regular LEMS) that we have deployed around campus.
Week 2: May 25-29, 2015
This week we started on building a contraption, which we dubbed "the albedometer." It measures the reflectivity , or albedo, of a surface. Our device consists of two PAR (Photosynthetically Active Radiation) sensors and two Licor sensor attached to a bar on a tri-pod. The PAR sensors measure the spectrum of radiation coming from the sun that plants are capable of absorbing. The Licor sensors measure the rest of the spectrum of radiation coming from the sun. Pictures of the device in action will be posted with a more accurate description of how the albedo of a surface is calculated using our contraption once we put it to use.
Week 3: June 1-5, 2015
We have continued monitoring the LEMS stations around campus and are learning how to program in MatLab as a means of quality checking the data we are collecting. We also finally ran our albedo experiment, which consisted of us dragging our "albedometer" across campus and taking data in five different locations. Rain started falling at the same time we started collecting data which made for in interesting experience of shielding the laptop used to run the program under an umbrella and shielding the data logger and battery under a blanket. After all was said and done we had collected some quality data and should be able to find the albedo, or reflectivity, of the surface on that part of campus where we will be installing sap flux equipment down the road.
Week 4: June 8-12, 2015
This past week, we spent the beginning of the week updating a previous tree survey done on the engineering quad at the University of Utah. This involved us taking surveying equipment (a view finder equipped with a compass and laser) around campus to fill in trees that had previously been missed as well as re-surveying old trees that had been mixed up during the cataloging process. Apart from making sure all of the trees in the engineering quad were surveyed, we surveyed almost 100 new trees on another part of campus where we will be starting to set up sap flux measurements this coming week. We finished the week off by assisting in the installation of a 3-meter energy flux tower in the middle of the engineering quad on campus, which is comparable to the GAMUT stations that are managed by iUTAH. This involved a few hours spent in the sun digging up sod to install heat flux plates and temperature and moisture probes, as well as piecing together the actually tower, and attaching sensors.
Week 5: June 15-19, 2015
This past week has been busy and full of learning experiences. We learned how to solder so we could make some connectors to connect some sensors to a datalogger. We also learned how to write a program for the dataloggers, a CR5000 in our case, so we can hook up a bunch of different sensors and instruments to it and have it collect data ranging from wind speed and direction, to air temperature and humidity, to the temperature of pine needles. We also set up a 7 meter tall metal pole next to a pine tree onto which we will be installing the CR5000 datalogger equipped with a range of different sensors and instruments to gather information about the energy flux going in and out of this tree and surrounding area.

This week we learned how to solder wires to an auxiliary cord which we will connect to some PAR (Photosynthetically Active Radiation) sensors. These sensors will be wired into a datalogger.

Here is the CR5000 datalogger that we will be using to take energy flux data on a pine tree on the University of Utah campus.
Week 6: June 22-26, 2015
This week we were extremely busy getting everything ready (sensors, dataloggers, programs, permission from grounds and anything else we needed) to install an energy and water measurement station by two different coniferous trees on campus. We learned how to make sap flux probes. These are basically little needles with thermocouple wire inside that are drilled into the trunk of the tree to measure the temperature difference between two points, from which the amount of water moving through the tree can be extrapolated. By the end of the week we had put up two 6-meter tall metal poles tightened down by guy wires next to each tree with a CNR1 (a radiation sensor) and a RM Young WindBird (a wind direction and wind speed sensor) attached to the top of each pole. PAR sensors (Photosynthetical Active Radiation sensors), needle thermocouples (to measure the temperature of needles) and an HMP45 (a air temperature and relative humidity sensor) were next attached to one of the trees and the CR5000 datalogger that all sensors were attached to began logging data. A plan to install the sap flux probes on the first tree and all of the missing sensors for the second tree will commence at the beginning of this coming week.
Week 7: June 29-July 3, 2015
Our two study trees on the University of Utah campus are now up and functional after a full day spent dodging sprinklers that kept coming on every twenty minutes and catching us by surprise and laboring in 100 degree weather. The two coniferous trees are fully equipped with radiation sensors (measuring incoming radiation as well as photosynthetically active radiation); wind speed and wind direction; air temperature and relative humidity; needle temperature; and sap temperature (which will later be used to find water flow up the tree). This coming week we will be installing a LEMS tower on top of one of the buildings in the engineering quad and making sure all of the sensors on our experimental trees are working properly and giving data values that make sense.
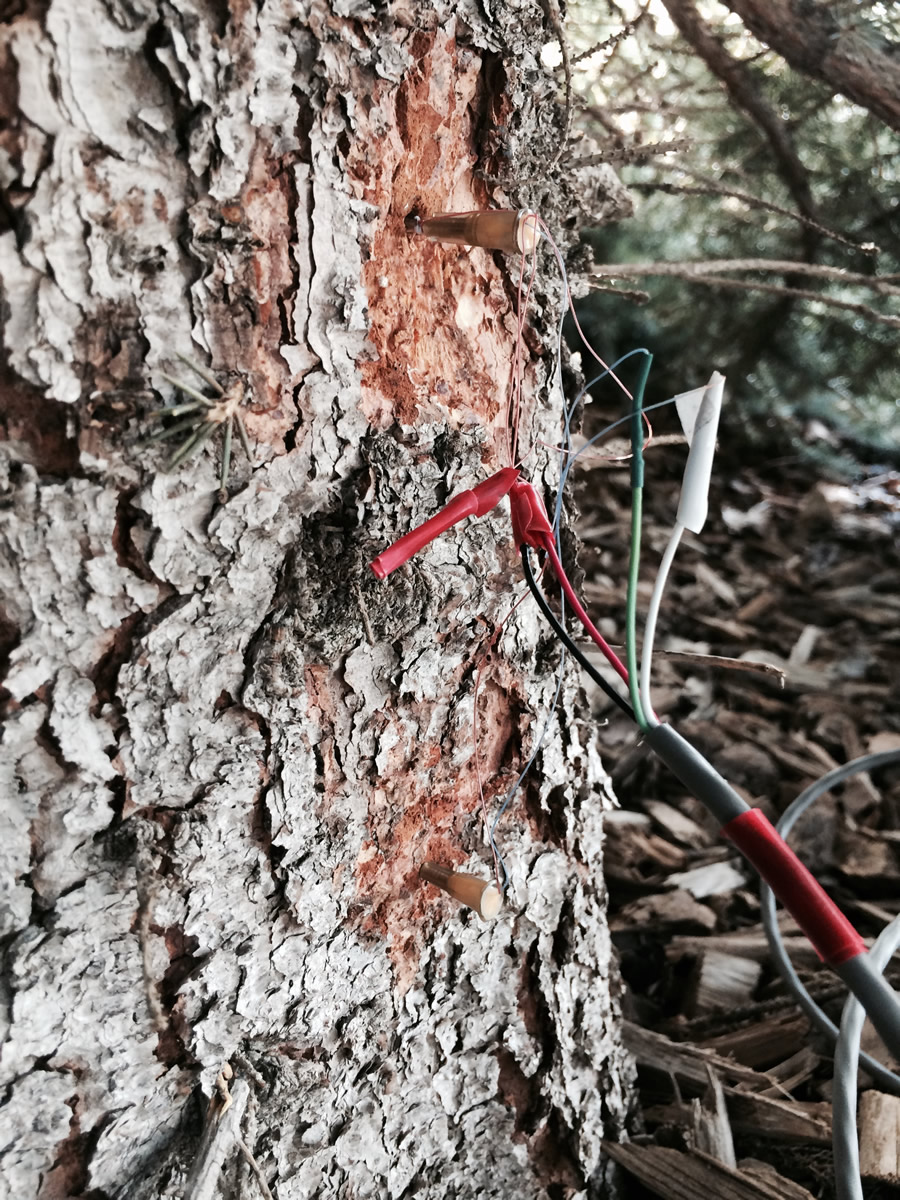
Here are what the installed sap flux sensors look like. They are the small needles sticking out of the trunk (where the bark has been scraped back). The upper needle is heated and the lower needle is unheated.
Here are all the tools I needed to install the sap flux sensors under a tree.
To install the sap flux sensors I had to crawl on my belly under a coniferous tree with rather sharp needles and maneuver myself around the base of the tree on my stomach and back to drill holes into the tree and install the sap flux sensors.
Week 8: July 6-10, 2015
We spent the week doing maintenance on all our existing experimental stations. This included downloading data from all of our LEMS, SLEMS and study trees as well as adjusting any sensors and instruments that needed adjustment. Down time was spent gearing up for the upcoming iUTAH symposium and poster session.
Week 9: July 13-17, 2015
We spent the first half of the week using a Lidar scanner to create 3D images of our study trees. The Lidar scanner can take scans of an object using lasers (the scans we ran came back with about 40 million data points, each one represent by a laser point). After the laser scanning, the Lidar also takes colors photos of the object you are scanning. We took four scans of each tree from various points around the tree. The laser points for each scan can later be combined on the computer to recreate a 3 dimensional "point cloud" of the tree. This can then be overlaid with the photos to introduce color to the tree. The latter part of the week was spent analyzing data and gearing up for the iUTAH Symposium in Midway, UT.
Week 10: July 20-24, 2015
We spent the week manufacturing more sap flux sensors to install on secondary study trees this coming week. We also wrote a new program for the CR1000 dataloggers that we will be running the instrumentation for the secondary trees off of. We will be deploying the sap flux sensors and some needle thermocouples on four secondary trees in the engineering quad by one of the main study trees.
Week 11: July 27-31, 2015
The final week of the program was a busy one with gearing up to present at the final symposium and attempting to finish installing the last elements of our experiment. We installed sap flux sensors and needle thermocouples on three additional secondary trees. The only thing remaining to do is to install a rooftop reference PAR sensor that will likely take place this upcoming week. The iUTAH program has been a fantastic experience and I look forward to my adventures in the weeks to come and for my fall semester to start at Westminster College. Signing out for the last time, this is Sawyer Hill.