iUTAH Team - Undergraduate iFellows
Katelyn Boyer
Utah State University
Mentors:
Faculty: Sam St. Clair, BYU
Graduate: Jordan Maxwell, BYU
Research Focus:
Research Focus Area 1
Major:
Physical Geography
Biography:
Katelyn Boyer is a senior majoring in physical geography at Utah State University. She is especially interested in hydrology and geographic information systems where she hopes to travel the world doing research and teaching others about the world we live in. When not in school or working she spends her time gardening, baking and hiking. By being part of the iFellow, she is excited to learn and gain a better understanding of water research.
iFellow Presentation:
Fire Severity Increases Snow Accumulation in Mixed Conifer Forests
Presented by: Katelyn Boyer
July 2016
Weekly Recap:
Week 1 | Week 2 | Week 3 | Week 4 | Week 5 | Week 6 | Week 7 | Week 8 | Week 9 | Week 10 | Week 11
Week 1: May 16-20, 2016
This week has been a learning experience. Monday was the orientation where we learned about the iFellow program and introduced ourselves to the other iFellows. Tuesday and Wednesday I spent the day reading papers that related to the research I will be doing this summer to gain a better understand of the research paper and other projects I need to accomplish for the iFellow program. Thursday I spent the day finishing up the homework for the next cohort session and analyzing the data that was collected earlier this year. Friday was spent researching more about the topic I will be doing my research project on this summer.
Week 2: May 23-27, 2016
Monday was the second cohort session in Logan, Utah. We learned how to design our posters for the program and learned the requirements for WATS 4600. For the rest of the week I worked with the snow data that was already collected, using it to create maps and figures in the ArcMap program. The maps that I am creating will be used for my poster and will give me a better understanding of the research project I will be working on this summer. I also worked on the intro and methods for my research paper.
This picture shows the several maps I am making to include on my poster. Going from left to right the maps show the study
site locations with data of vegetation change, elevation change, and aspect of the mountains.
Week 3: May 30-June 3, 2016
This week I was at the Lytle Ranch Preserve, which is located in the southwest corner of Utah. At the beginning of this week Ashley and Bailey, who are undergrad students, and I set up 80 pit fall traps in 5 block areas to collect the different types of insects in the areas to compare how they differ from burned and unburned areas. The next couple of days we spent doing shrub density and fruit counts in the 5 blocks. At the end of the week the pit fall traps were collected and will be sorted sometime this next week. Through this week I was able to learn about the different plants that grow in the desert and about the animals that live there.
Week 4: June 6-10, 2016
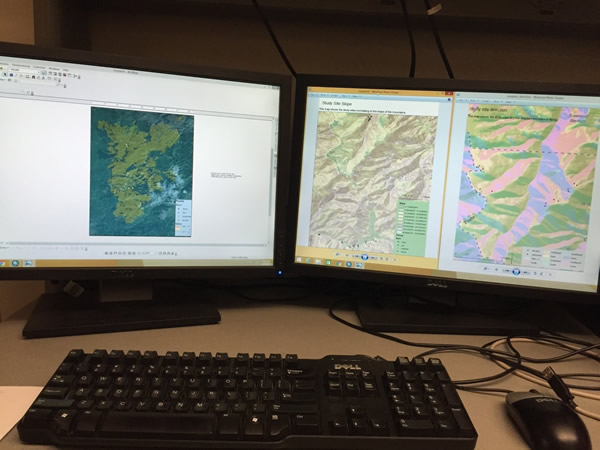
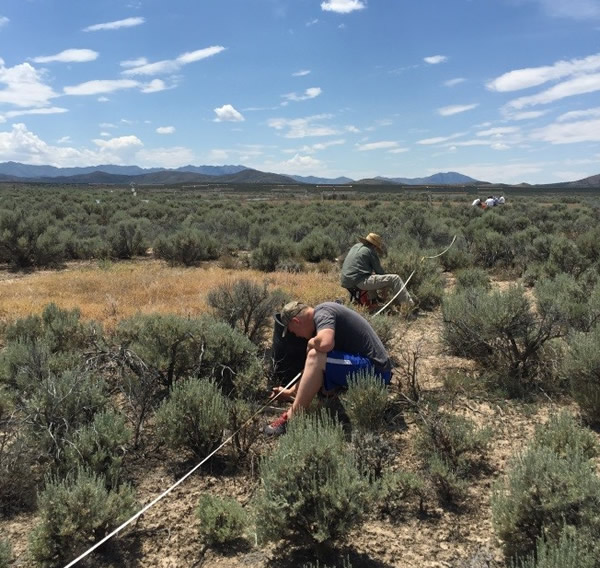
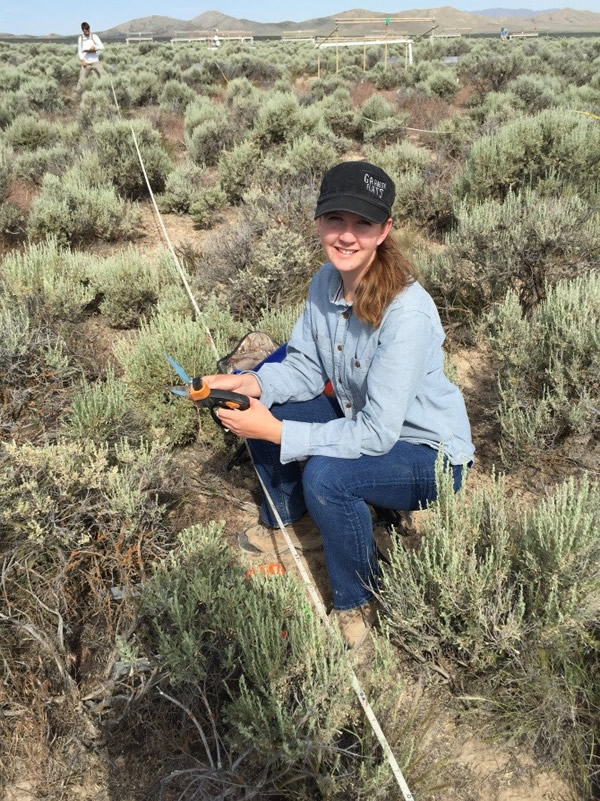
In the lab that I am working in this summer there are several different grad students all with their own research projects. One of my goals for this summer is to gain a broader understanding of how to do research and the different types. This week I accompanied Terra in her research project at Rush Valley which is an hour and a half west of Provo. At Rush Valley there are 5 plots that experience different conditions to see how it affects the plants in the area. For this week I learned how to collect biomass, frequency of plants and, the variation of the plants. Overall this week has been a good learning experience to help me broaden my horizon.
Week 5: June 13-17, 2016
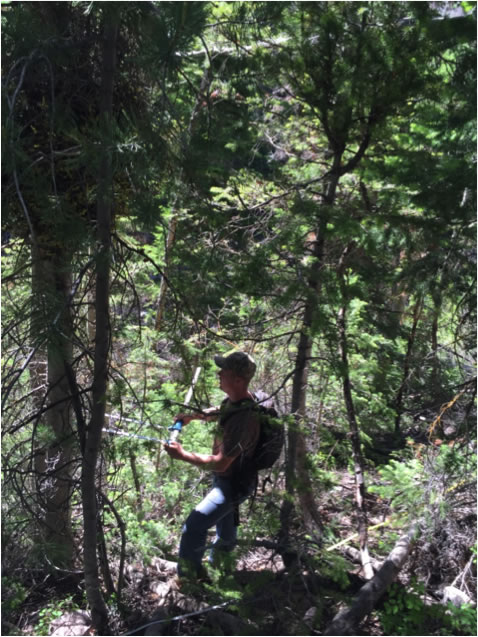
Monday was the third cohort session at BYU where we presented the intro and methods for our posters to the other iFellows. Later in the day we traveled up Provo canyon where we learned how to take different water samples. The rest of this week I spent collecting forest characterization data for my research project. With my mentor Jordan and two other undergraduate students Baily and Emma, we traveled down to Fishlake National Forest. In Indian creek and Shingle creek canyons, there are twelve block sites where we characterized the forest by tree height, Diameter at breast height, species and, if the trees were alive or dead. With all the data that was collected I will be entering it into an excel data sheet making it possible to compare it to the snow data that was collected for the past two winters.
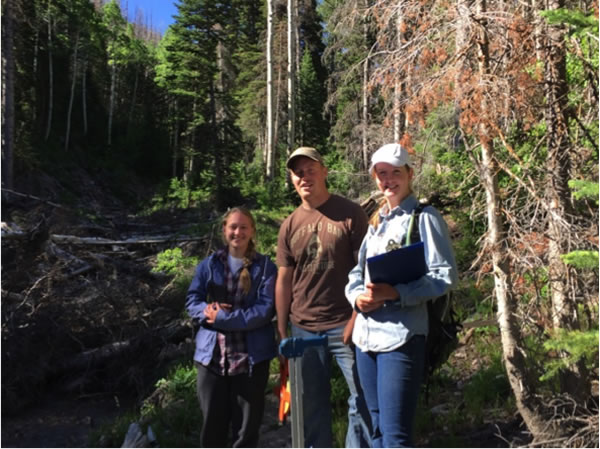
Emma, Jordan and, I after finishing collecting the forest characterization data.
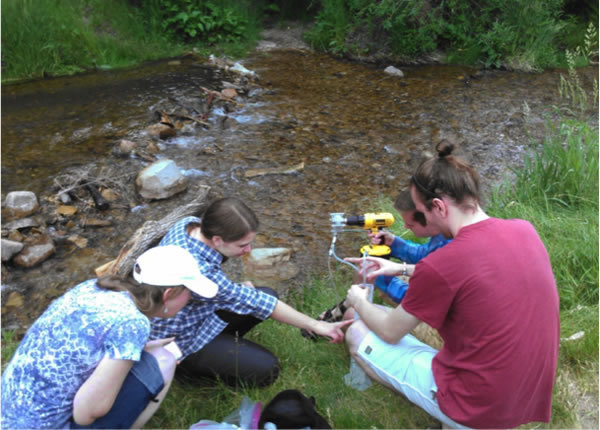
Natasha showing us how to purify stream water to be used for testing.
Week 6: June 20-24, 2016
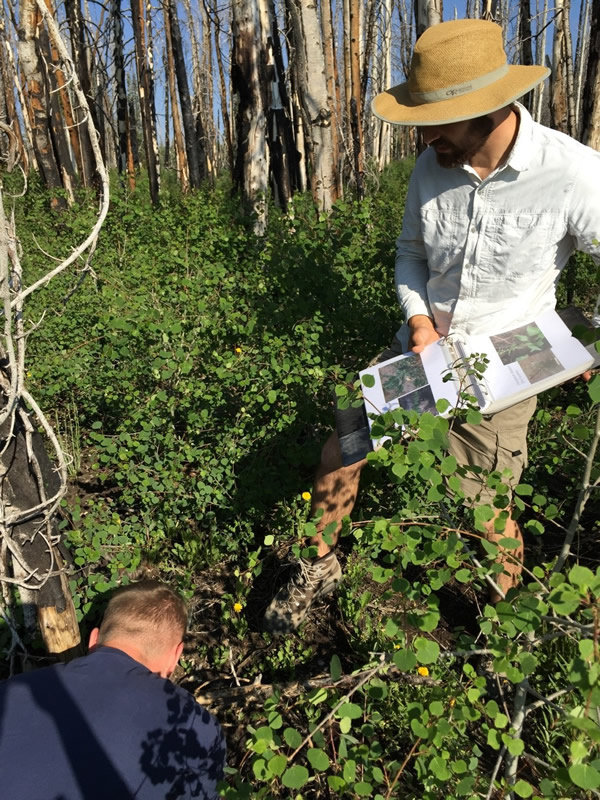
Monday through Wednesday I spent the day learned a little about forest plant identification. With a group from my lab, I traveled up to Skyline drive recording plant species in different study sites each under a certain condition. The first study sites were 2x2 meter plots consisting of a fenced and non-fenced area were we recorded what plant species were present or absent. By analyzing the data we will be able to see what plants are not growing due to grazing. The second set of study sites we visited tested what species of plants would grow in a burned area if different animals excluded from that area. Thursday and Friday I finished entering data from last week forest characterization and tried to figure out how to use the data to create desired figures for my poster.
Week 7: June 27-July 1, 2016
Monday was the fourth cohort session where we learned about the importance of keeping connections with different mentors. Having several different mentors is important to help you reach your overall goals. We also spent some time learning about and visiting different GIRF and GAMUT sites. For the rest of the week I have spent my time analyzing the data that we collected on forest characterization. I have been working in excel to create different graphs to display the data in a clear and concise form. Some of the graphs I have created show how forest density, using stem per hectare and basal per hectare affect snow accumulation. I have also created some graphs comparing the burn severity blocks with mortality and will be creating graphs dealing showing how percent mortality effects snow depth. I have found that the more I work with the data in excel, the more comparisons I am able make. Overall it has helped me to gain a better understanding of the data that we collected and is helping me broaden my horizon.
Week 8: July 4-8, 2016
In this video I explain the research I have been doing over the summer and show how fires affect snow accumulation through different graphs. Focusing on percent conifer mortality, our study shows an increase in peak snow accumulation in severely burned forests due conifer mortality but whither that results in more available water resource still remains unknown.
Week 9: July 11-15, 2016
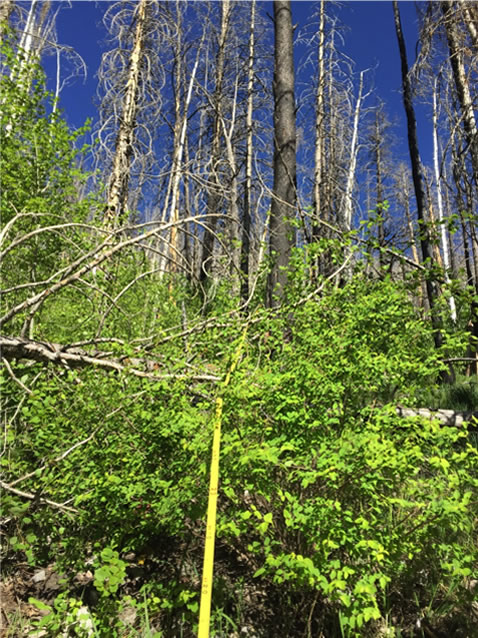
With my internship drawing to a close I have been trying to get everything finished. Finishing my poster for the IUTAH Summer Symposium was my main goal for the week. The research I have been working on for this summer is how fires affect snow accumulation in mixed conifer forest. For my poster I decide to focus on how percent conifer mortality relates to snow depth. Using excel I created a scatter plot using the 2015 and 2016 snow data and the percent mortality data. Figure 1 shows that as percent conifer mortality increases snow depth increases. Taking percent conifer mortality and comparing it to burn severity shows that as burn severity increases, percent conifer morality increase (figure 2). From these two graphs we concluded that as the burn severity increase snow depth increases. Whether this transfers to more available water, is unknown. Further research is needed on how snow ablation is affected by burn severity. With more open stands due to higher burn severity we would also expect more solar radiation, greater wind speeds, and higher vapor pressure deficits which tend to increase losses to sublimation and evaporation which may offset higher rates of snow accumulation in areas with higher burn severity.
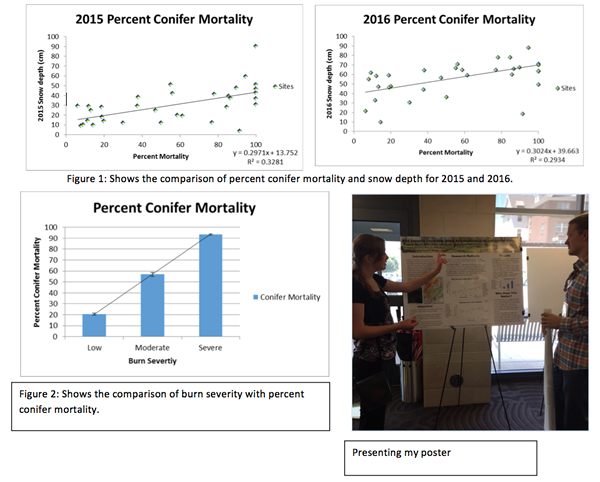
Figure 1: Shows the comparison of percent conifer mortality and snow depth for 2015 and 2016
Figure 2: Shows the comparison of burn severity with percent conifer mortality.
Presenting my poster
Week 10: July 18-22, 2016
This internship has gone by fast and I have learned so much from it. This week I have worked on writing my final paper and creating my PowerPoint presentation that I will be giving this upcoming Wednesday. It has been interesting to learn about the different types of research that have been conducted on fires and snow water equivalence. Writing my paper has given me a broader understanding about the effect fires have on snow accumulation in mixed conifer forests through the different types of research studies that has been conducted. Each research study has tested different variables making it possible to gain a better understanding of fires and snow water equivalence. Even though this internship is almost over I am excited to continue to expand my knowledge about the world we live in.
Week 11: July 25-29, 2016
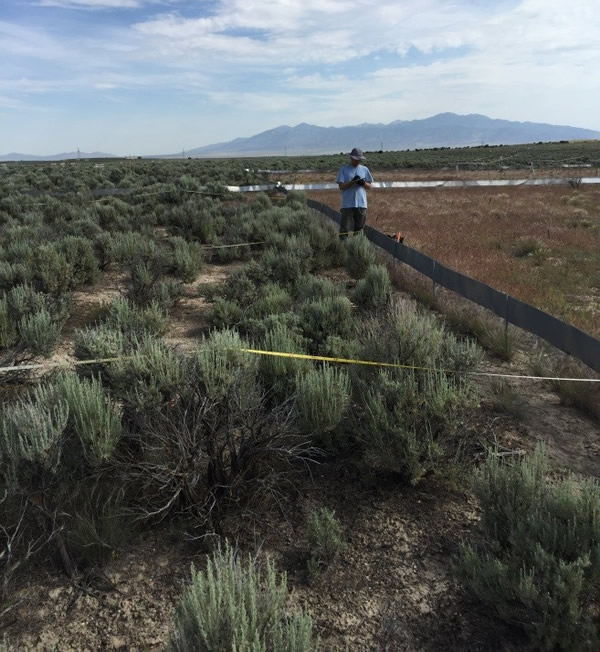
It is hard to believe that this is the last week of the ifellow program. It seems like I started couple of weeks ago instead of two months ago. Through the summer I have learned a lot about my research project and other grad student’s research projects. With this being the last week of the program I spent most of my time writing my final paper but I was able to help Josh with his research project in Rush Valley. In the same blocks that I helped collect biomass in, 80 small animal traps were set up to collect the small mammals in the area. The traps will make it possible to see what small mammals affect the vegetation in the different blocks. Being part of the ifellow program has been a good learning experience and I look forward to applying what I learn in the future.
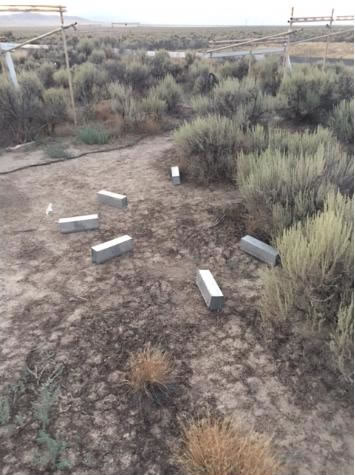
Setting up the small animal traps in one of the blocks
All content provided on this iUTAH Team - Undergraduate iFellows weekly recap is unedited, updated by each participant to provide a review of their progress, and is for informational purposes only.