iUTAH Team - Undergraduate iFellows
Stacy Henderson
Salt Lake Community College
Mentors:
Faculty: Joanna Endter-Wada, USU
Graduate: Enjie Li
Research Focus:
Research Focus Area 2
Major:
Environmental Geology
Biography:
Stacy Henderson just graduated from Salt Lake Community College with an Associate’s in Environmental Geology and plans to attend Westminster College to complete her Bachelor’s in Geology. In the course of her studies she has found a passion for studying water and how water management impacts environments and people and hopes to pursue her master’s degree in a hydrology or hydrogeology related field. In her free time she loves to be outside doing any number of outdoor sports.
Weekly Recap:
Week 1 | Week 2 | Week 3 | Week 4 | Week 5 | Week 6 | Week 7 | Week 8 | Week 9 | Week 10 | Week 11
Week 1: May 16-20, 2016
This week I met the people I will be working with over the summer. Dr. Joanna Endter-Wada, Enjie Li, and Dr. Shujuan Li. I got introduced to Enjie's research and learned about her ideas for how I could help her in that research. I then read research papers that Enjie, Dr. Endter-Wada and Dr. Li had authored to get a better idea of what their research entails. I read a chapter of a book written by Dr. Endter-Wada, and got started on my CITI certification.
Week 2: May 23-27, 2016
This week I finished up my Human Subject CITI training. I also continued to read the research published by my mentors. One of my mentors started preparing data she is going to have me work with and hopefully I'll begin working with that next week.
Week 3: May 30-June 3, 2016
This week I did some data mining for one of my mentors. I gathered general plans for each of the 10 counties she’s studying as well as gathering land and water use data for her. In the process I located USGS water data from 1985-2010 to help her with her dissertation. This is a very detailed data set, which includes a lot of information she was hoping to find. As my mentors went over this data, they found a good project for my summer iUTAH research. I will be analyzing this USGS water use data to see if I can find any general patterns in the usage between counties, and if there’s time, I will proceed to compare that to population growth, then to see if there are any patterns in usage between types of developments in the 10 county Wasatch Range area. I began cleaning this USGS data and analyzing it at the end of the week. I look forward to the coming weeks to see what I find.
Week 4: June 6-10, 2016
This week was a busy one. I continued to organize water use data, started cleaning and analyzing it, and worked on comparing data for four counties of the ten contained in the Wasatch Range Metropolitan Area (WRMA). Because I’m new to this type of work, I started a spreadsheet to help me track trends I find. Meanwhile, I joined Maura Hahnenberger on Wednesday, June 8, for a Bio-Blitz near Timpanogos Cave catching and documenting bats. That was really fun and I recommend everyone take part in this at least once. Finally, I started work on the introduction and methods portion of my poster. It’s a very rough draft right now as I’m still knee deep in trying to analyze data, but I look forward to refining it as I continue with my project.
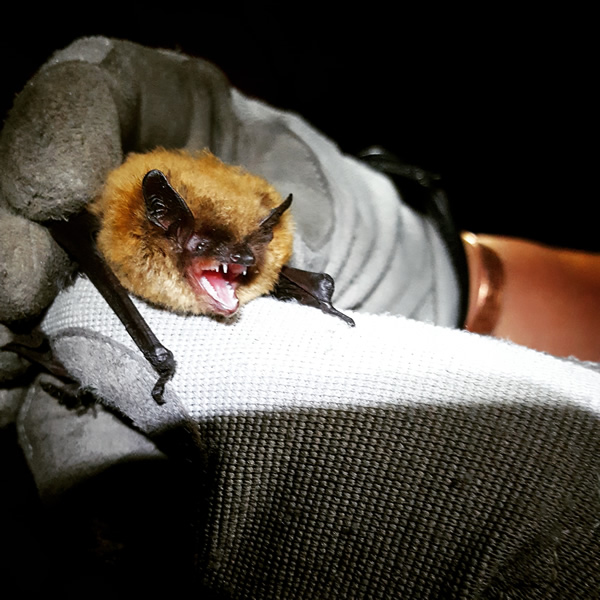
Little Brown Bat
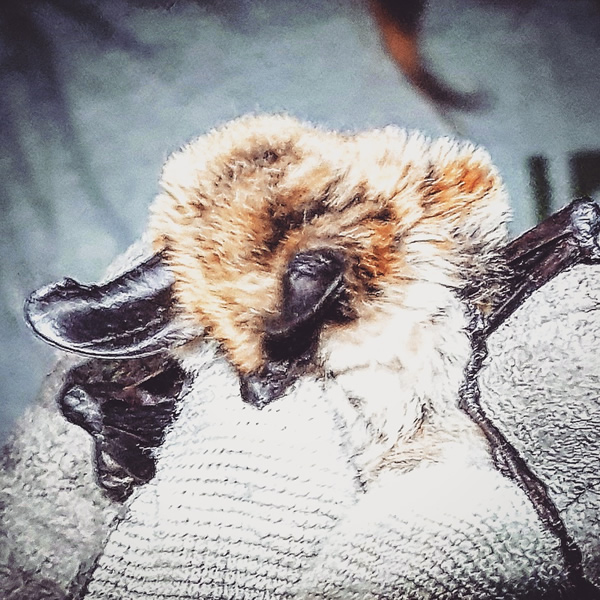
Western Small-footed Bat
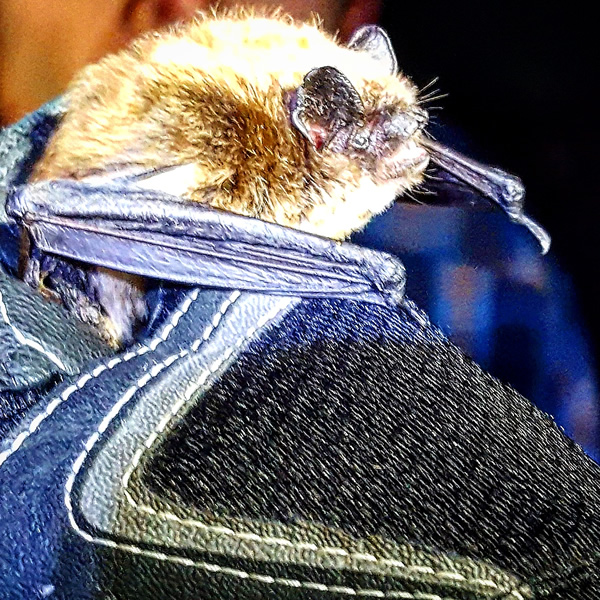
Western Long-eared Bat
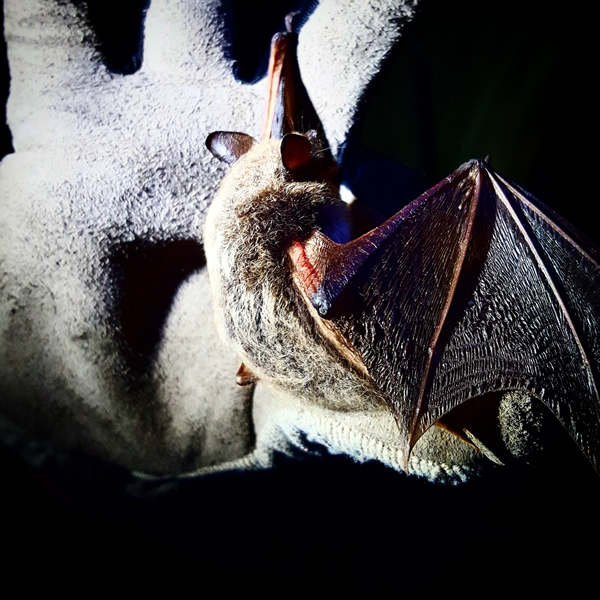
Little Brown Bat
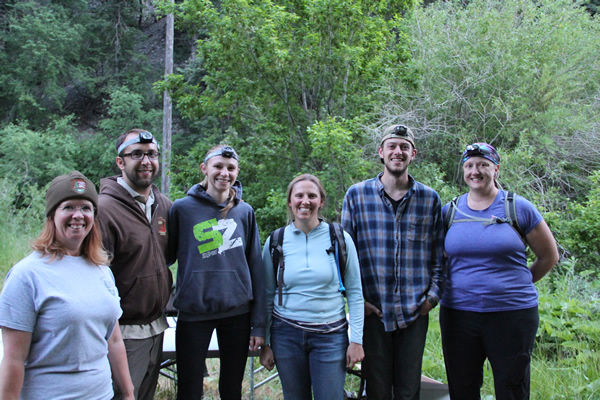
Citizen scientists at the Bio-Blitz 2016 bat netting event near Timpanogos Cave
Week 5: June 13-17, 2016
The first half of this week was spent completing the cleaning of the USGS data and making charts to try to analyze the data and find some trends. The 2nd half of the week was just spent making various charts and graphs in Excel comparing different categories within my dataset. As I began to find trends I then started research into the possible reasons for the trends. I also began documenting questions and findings that I can use in the future for my paper and poster on my research.
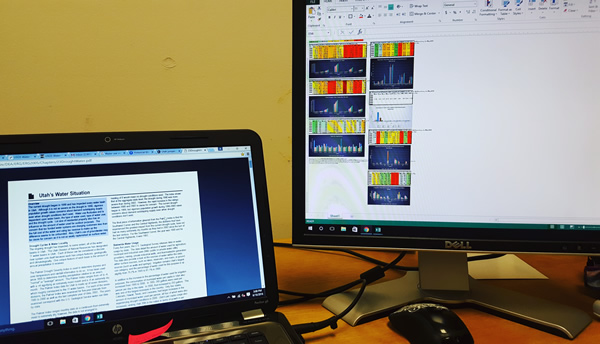
Is this what research looks like? Graphs, graphs, and more graphs.
Week 6: June 20-24, 2016
This week resulted in a change of plan for my project. It was ultimately discovered that the USGS data set I had been working with was extremely complicated and didn’t yield a lot of results due to a lot of problems within the data. So my mentors and I met and brainstormed a new rough idea that would utilize my GIS skills. I started work on this new project on Tuesday and refined what it was going to entail with Joanna on Wednesday. Thursday and Friday were spent creating rough drafts of maps that will show, geographically, different water policy boundaries within Utah. I also began research on what entities within Utah govern which types of water policies for my research paper. It’s been a stressful and busy week, but I feel I have a good start to this new project. Although this change has been difficult as it has come so late, I was able to get experience working with and analyzing difficult, incomplete data and learn a lot about why, scientifically, some of my ideas for that data wouldn’t work.
Week 7: June 27-July 1, 2016
This week I spent creating maps in ArcGIS for my project. I will be displaying water institution boundaries in a series of maps for various water agencies within Utah. A lot of the time creating the maps I worked on this week was spent searching the USGS and Utah AGRC websites for applicable GIS data. I also made phone calls and sent emails to obtain data that wasn’t located on the internet. I ended up talking with both Utah AGRC people and the Department of Environmental Quality people and learned a lot about data I was looking at. I also researched the exact legislative policies that define what each agency is responsible for and how they are set up. Overall it was a very busy and mostly productive week.
Week 8: July 4-8, 2016
This week I started my poster, created more maps, and refined maps for my project. Once I got the poster layout figured out with the help of my mentor Dr. Joanna Endter-Wada, I figured out what further maps I would need to create to complete the layout we chose. I then worked with my other mentor Enjie Li to clean up and refine my maps. I finished the week by working hard with both mentors to create a complicated water conservancy district map and get the final rough draft of my poster completed for our cohort session on Friday.
Week 9: July 11-15, 2016
This is a brief video about my iUtah summer research project. This project mapped selected features of the water policy landscape of Utah for comparison to Utah’s bio-physical water landscape. The map series visually displays the geographic domains of different governmental institutions’ authorities. This is important because water institutions generally have administrative boundaries that are not necessarily consistent with those of other water institutions. However, these boundary variations reinforce the need to communicate and coordinate through various boundary-spanning activities.
Week 10: July 18-22, 2016
This week I did a bit more research for both my paper and my presentation, worked on my presentation for the final symposium, and finished the full rough draft of my paper. I found some new information that I hadn’t previously found regarding my project that was extremely useful. I also managed to speak with someone at the Utah Association of Conservation Districts who was able to give me more details on what they manage and what other water agencies they work with. This information was invaluable and got added to my paper and presentation. I’m definitely excited for the new information I found and believe it fills in the gaps in my research that were bothering me.
All content provided on this iUTAH Team - Undergraduate iFellows weekly recap is unedited, updated by each participant to provide a review of their progress, and is for informational purposes only.