This site is being archived for historical purposes. The information contained within may no longer be accurate or up-to-date. Please note that the content of this page is no longer actively maintained and may not reflect current information.
innovative Urban Transitions and Aridregion Hydro-sustainability
iUTAH Undergraduate iFellows
Week 5 Recap
June 13-17, 2016
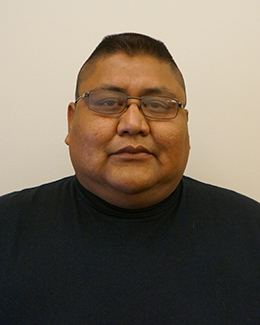
Joydino Beyale
This week was a short week, but I was able to do some lab work with the samples I have collected on the 12th of June, I am looking forward to collect more and have more samples and data to work with before next week, but it all depends on the weather, in the meantime, I’m still learning about lab procedures and techniques.
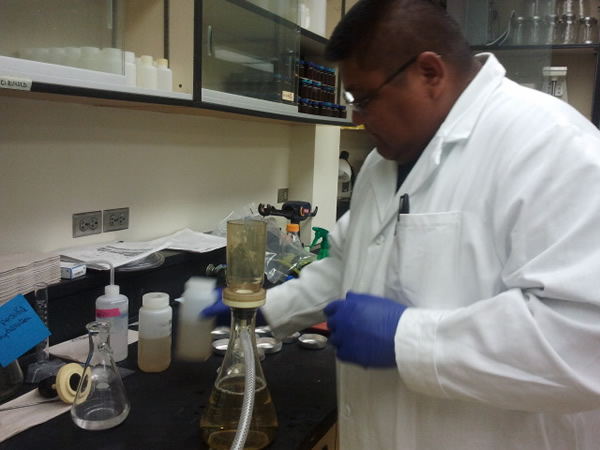
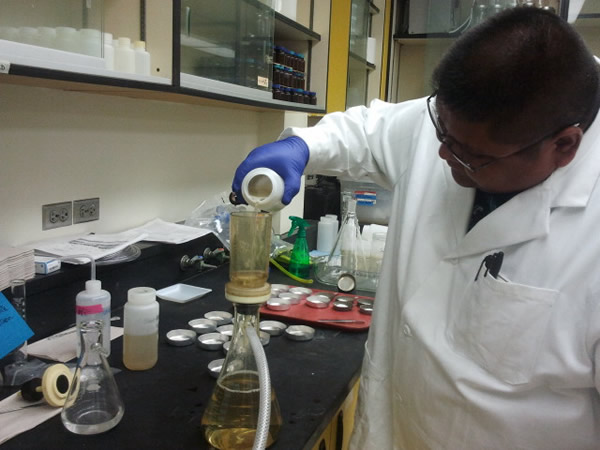
Working in the Lab doing TSS (Total Suspended Solids)
Another picture working with TSS
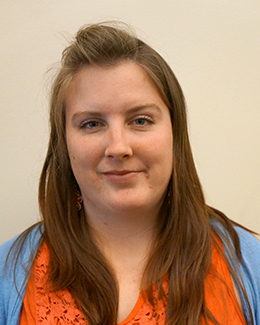
Heather Bottelberghe
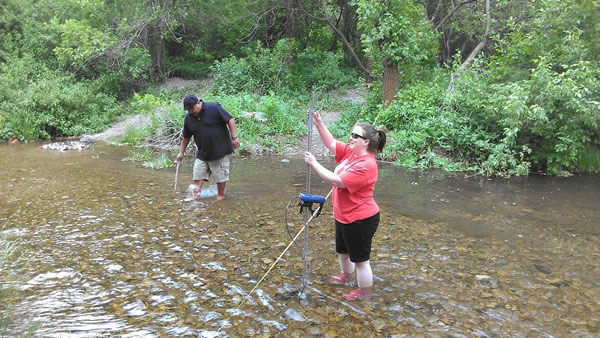
Monday was our third iFellow cohort session. All of the iFellow interns met in Provo at BYU. We did some fun exercises to practice presenting our research topic. Later that day we went to Provo Canyon where I learned how to measure the flow of a river using a flow gage and I also participated in testing water samples for phosphate, nitrate, sulfate, and E. coli. I loved the water sampling field trip, it was so much fun!
The rest of this week was spent working in the lab with computers. Some time was spent digitizing the curbs layer for the Cache Valley irrigation research. I also began working with Photoshop and another mosaicking software to find the best way to mosaic the thermal IR imagery taken at Swaner Preserve. It is amazing to see the output after the software processes the images.
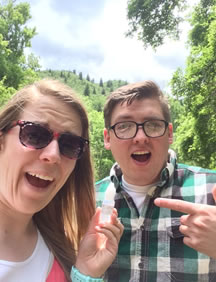
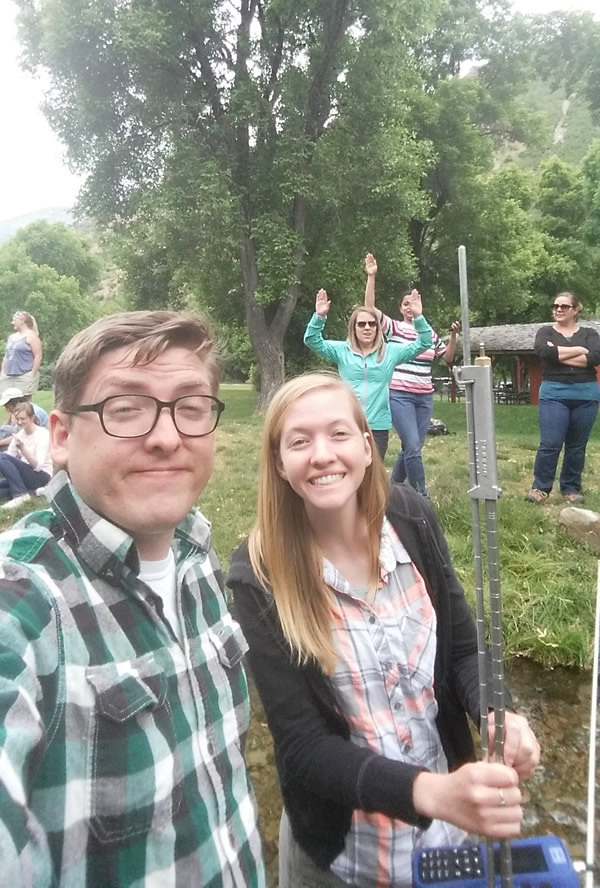
Measuring the velocity of the river's flow using a flow gage. (Left) Joydino Beyale, iFellow. (Right) Heather Bottelberghe (Me).
Katelyn Boyer
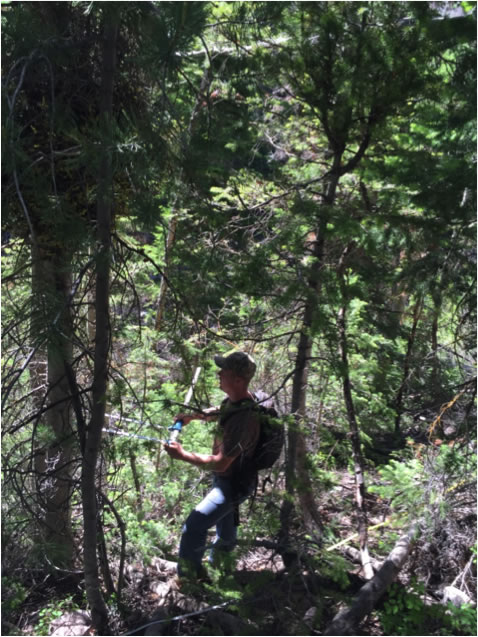
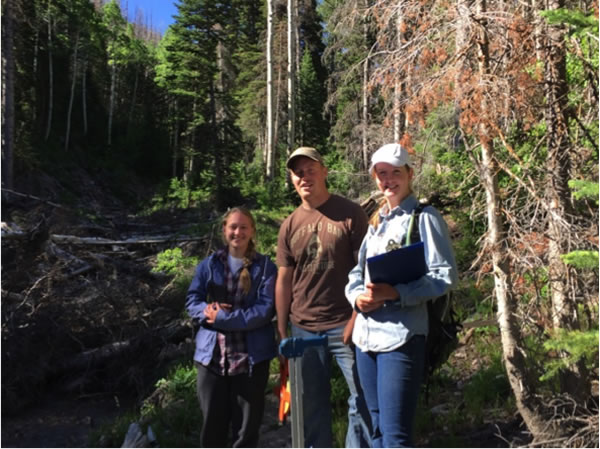
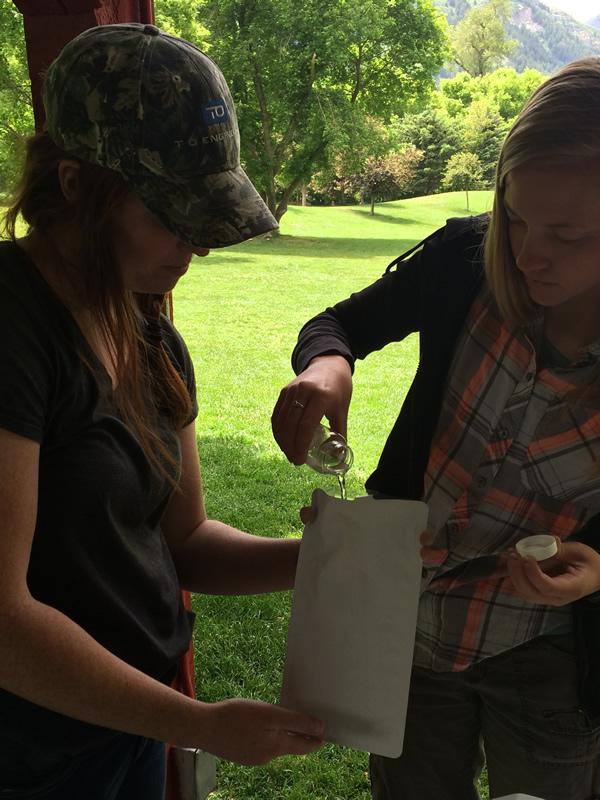
Monday was the third cohort session at BYU where we presented the intro and methods for our posters to the other iFellows. Later in the day we traveled up Provo canyon where we learned how to take different water samples. The rest of this week I spent collecting forest characterization data for my research project. With my mentor Jordan and two other undergraduate students Baily and Emma, we traveled down to Fishlake National Forest. In Indian creek and Shingle creek canyons, there are twelve block sites where we characterized the forest by tree height, Diameter at breast height, species and, if the trees were alive or dead. With all the data that was collected I will be entering it into an excel data sheet making it possible to compare it to the snow data that was collected for the past two winters.
Jordan taking the diameter of a tree in a low burn severity site.
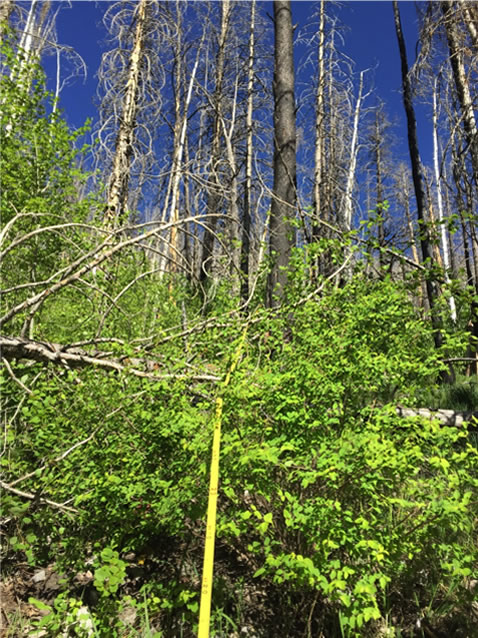
A measuring tape dividing a severely burned site.
Emma, Jordan and, I after finishing collecting the forest characterization data.
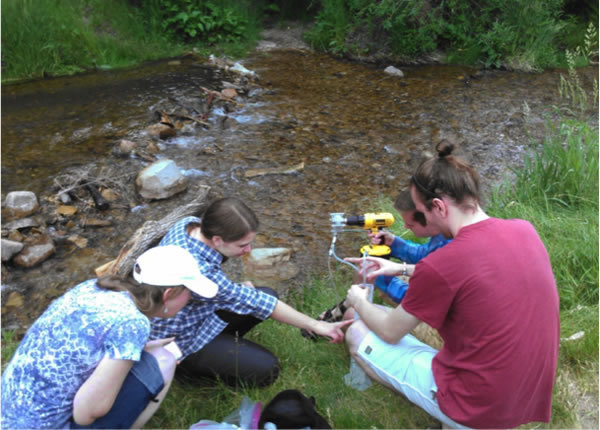
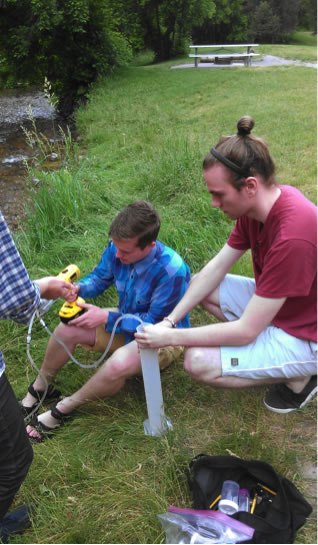
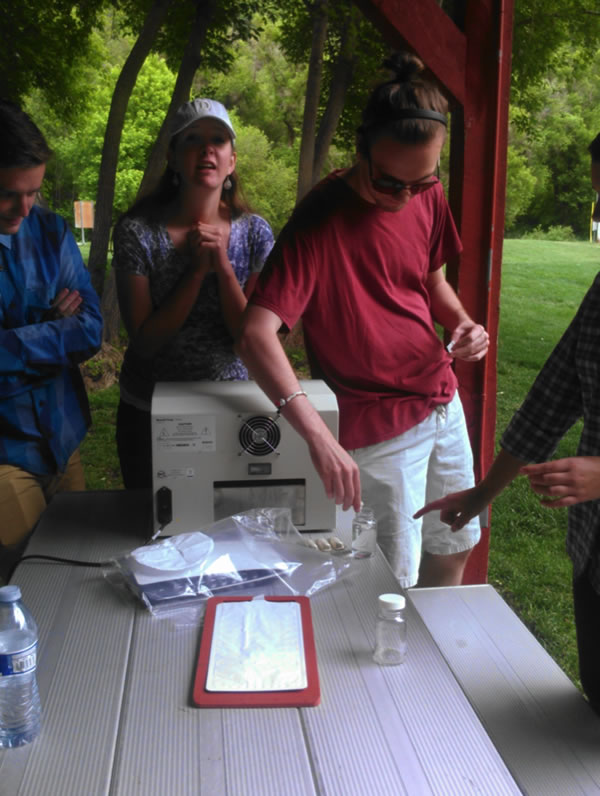
Natasha showing us how to purify stream water to be used for testing.
Todd Brown
This past week went really well! It started off with a great cohort session, practicing our presentations and also going to the Provo River to practice taking data was fun and educational! This week I spent more time working on the stage flow relationship and started finishing it up. Next step will be to graph it. I also did a lot of literature review this week of past work that has been done on the Lower Bear River and read over Ayman AlAfifi’s paper explaining the WASH model. I also spent some time learning about the interactive WASH model and learning how it works better.
Here we are learning how to filter river water to test
different substances in the Provo River
Darcie Christensen
Monday, we had our third cohort meeting at BYU. We spent a lot of time practicing explaining the introduction and methods sections for our projects. It was very valuable and I received a lot direction for the future of my poster. We also got to go up Provo Canyon, just past Vivian Park, to learn about determining river velocity, concentration of nutrients, and contamination by Escherichia coli. It was fun to get some hands-on experience in collecting data and samples. The river was a little cold, but bearable! Tuesday, I was trained in the PCR lab. Since they work with a lot of low density DNA samples in their lab, we had to learn about all the protocols to avoid contamination. We focused our efforts on the standards for the ammonia oxidation (amoA) genes. There were a few mistakes made with the pipetting of these samples, so the results were not great. Wednesday, we re-did the standards with better protocol and got much better results. Today, we ran some of the dilutions of the standards again and then started incorporating samples into the readings. Here’s to hoping we get awesome curves so that next week, I can finish up the samples for amoA. In between all the PCR activities, I did some further reading about isotopes and began working on an EXCEL spreadsheet for the allometric relationships of our plants.
Andrew Hackett and I working with the
acidifier for the nutrient sampling.
Rebecca and I testing the velocity of the river.
Georgie Corkery
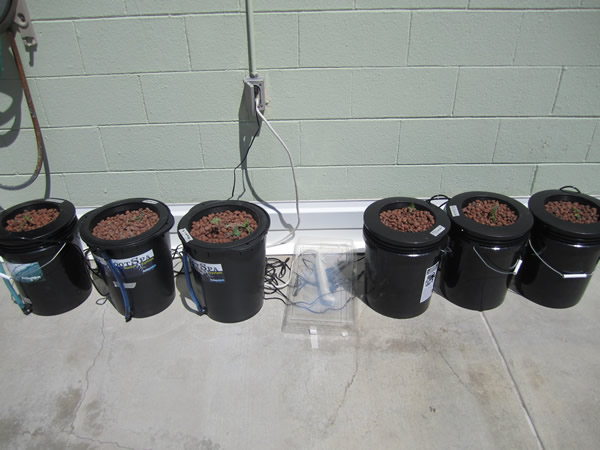
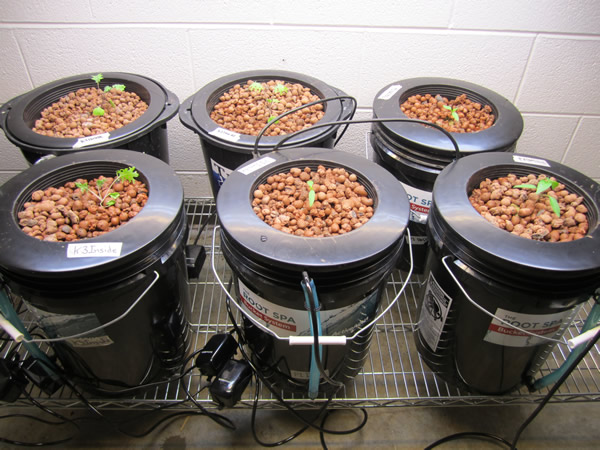
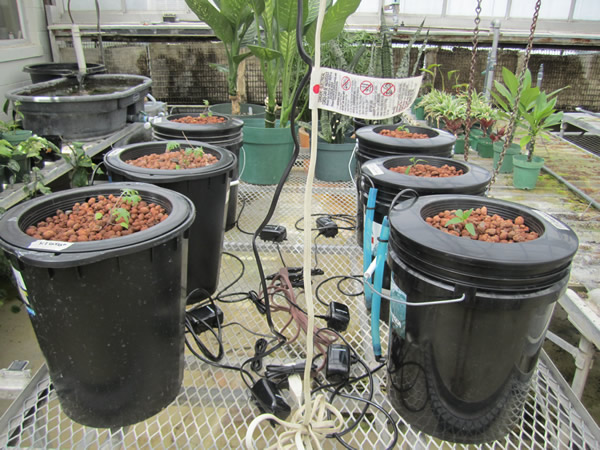
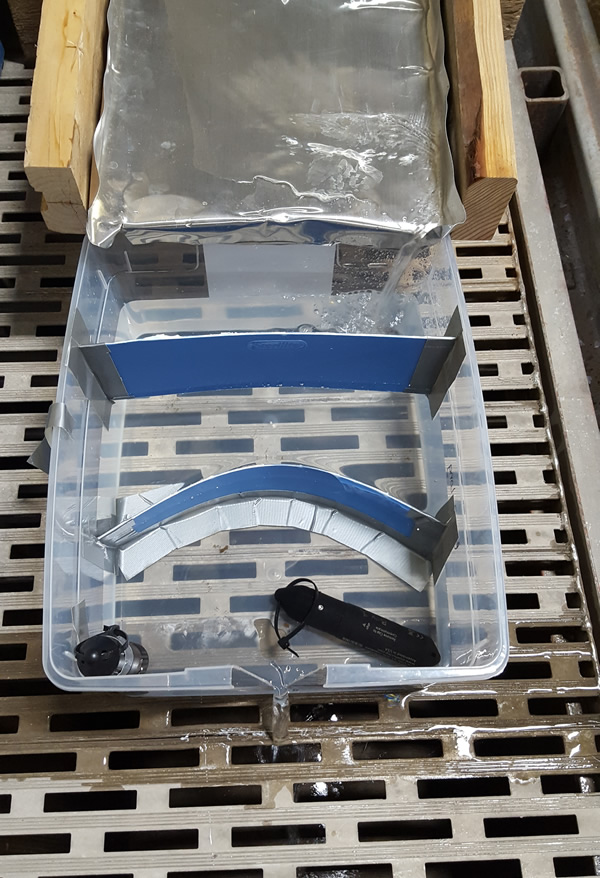
This week my research partner Sarah and I set up our hydroponic systems for our Hydroponic Lighting experiment! I am so excited to have the ball rolling on the project, however we have hit some bumps that I am trying to smooth out; the additional hydroponic systems that we ordered had a slightly smaller basket to hold the plants than the four we already had. This inconsistency would require us to put more water into the new systems than the old in order for the plants to be submerged. Therefore, I picked up four smaller baskets for the systems we already had and will transplant the plants into them this weekend!
To finish setting up for this project, next week I will transplant the peppers started in soil into larger containers. Overall, I am glad everything is in place (or on its way) for the experiment.
For my Home Hydroponic Kit project, we put together all of the material, planted five kale starts into our system, and hooked up the lights and air pump, and the system works! There are a few aspects of it that we would change, the size, color, etc., but we are well on our way through the design process!
I have set up three pepper plants and three kale plants (six totally) in their own hydroponic system in three different locations; inside, in a greenhouse, and outside. We will see which lighting requires the least amount of water for the most amount of yield!
Outside
Inside
Greenhouse
Cynthia Elliott
This week started with a Cohort meeting at Brigham Young University. At the meeting we practiced presenting our research topics and methods to each other. It was really useful to talk to other iFellows about my project and to hear their questions and get their feedback. We also went up Provo Canyon to do some hands on field work in the river. We took samples and tested the river water for Ecoli, which was awesome! Wading through that river was COLD! The activity reminded me how much I prefer working outside to being in an office!
The project I am working on is awesome, and I get to be outside often, giving surveys outside stores and at parks. We did quite a bit of that this week. We also went to a Community Council for the area we are researching, to explain what we are doing and to invite locals to take our survey. That was my favorite part of the week because we met a bunch of great people who were really passionate about being active in their community and were excited to take the survey. We also took time to fine tune what we say to people when we approach them, and I feel that it has been effective.
Andrew Hackett
This week we had a Cohort Session at the impressive BYU campus that culminated in a field trip up Provo Canyon to practice water-sampling techniques to measure stream flow, chemical content with a photometer, and how to prepare E. coli tests. Back at USU my week was mainly composed of inputting the attribute information from the notes taken in previous weeks for our curbside irrigation project and identifying areas that require closer scrutiny, as well as places we may have missed.
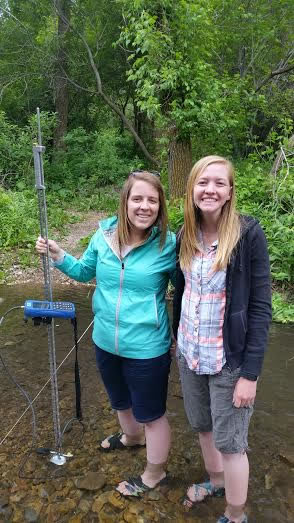
In this picture myself and iFellow Rebecca Lee are using a gauge to measure the depth and velocity of South Fork Provo River. Behind us are other iFellows and Mentors eager to come stand in the frigid water!
Greta Hamilton
This week started off with the iFellows meeting on Monday. We practiced presenting our posters, which was a welcome exercise for many of us who needed to work on our speaking skills. Monday afternoon, was spent at the Provo River learning various water testing and measuring methods. The rest of the week was mostly spent in the lab prepping the unfiltered Provo River samples to be analyzed for methylmercury. The MeHg analysis is time and labor intensive. It took two days from prepping to final analysis to run the unfiltered 24 hour samples. There are 52 amber vials, 24 containing the river samples, 24 containing the river samples with a 1 ppb matrix spike, and 2 field blanks. The first day, the samples were acidified and matrix spikes were added. The second day, each sample was manually adjusted to a pH of 3.99 - 4.09, and the sodium tetraethylborate is added to each vial for ethylation, which is how the organic Hg is detected. Each run also requires 27 additional amber vials for rinsing, calibrating, ongoing precision and recovery, and the mercury standards. The mercury standards are vials with milli-q water and specific known amounts of MeHg. Once the trays of amber vials were stacked in the Mercury Guru 4.7, it takes about 9 hours for the run to complete and the raw data to be available. We also conducted our weekly field sampling at Soapstone, Woodland, and Hailstorm.
Acidifying the 24 hour samples to be analyzed for MeHg.
Stacy Henderson
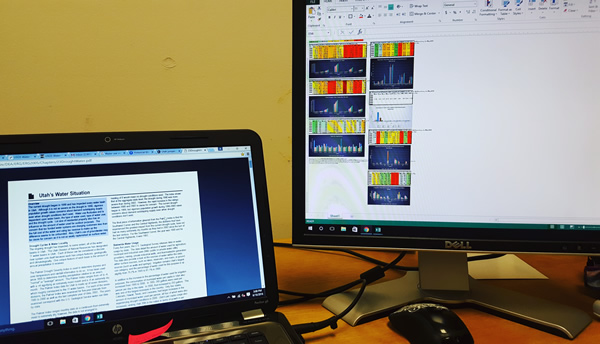
The first half of this week was spent completing the cleaning of the USGS data and making charts to try to analyze the data and find some trends. The 2nd half of the week was just spent making various charts and graphs in Excel comparing different categories within my dataset. As I began to find trends I then started research into the possible reasons for the trends. I also began documenting questions and findings that I can use in the future for my paper and poster on my research.
Is this what research looks like? Graphs, graphs, and more graphs.
Rebecca Lee
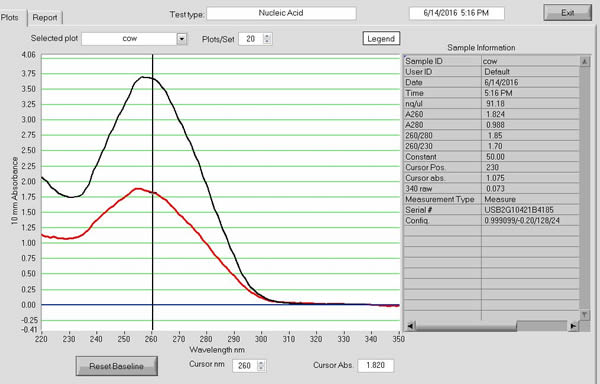
I definitely feel like we are getting into the swing of things with this past week! After a fun cohort trip on Monday that involved a field trip up the canyon, I was able to continue data collection. There was more DNA extractions to be done, we sampled water at Red Butte Creek and the Provo River, and I was able to preform PCR on the DNA we extracted. I am really enjoying the research I am doing. I love that I can go out and do field work and then go back to the lab to analyze the samples we collected.
Testing river water for E. coli during Monday's cohort session
Results from some of my DNA extractions
Gabriela Martinez
Who would have thought that creating a survey could be so much fun! That's exactly what I have been doing for the past week. My near-peer mentor has been great in guiding me through this whole process, and I am also very lucky to have access to the rest of the lab members and their invaluable feedback. Everyone has been so helpful, and welcoming! I am very excited to be able to finish editing our survey today, so that we can start contacting people and setting up times for interviews next week. I can't believe we only have five weeks left in the program.
Mitchell Steele
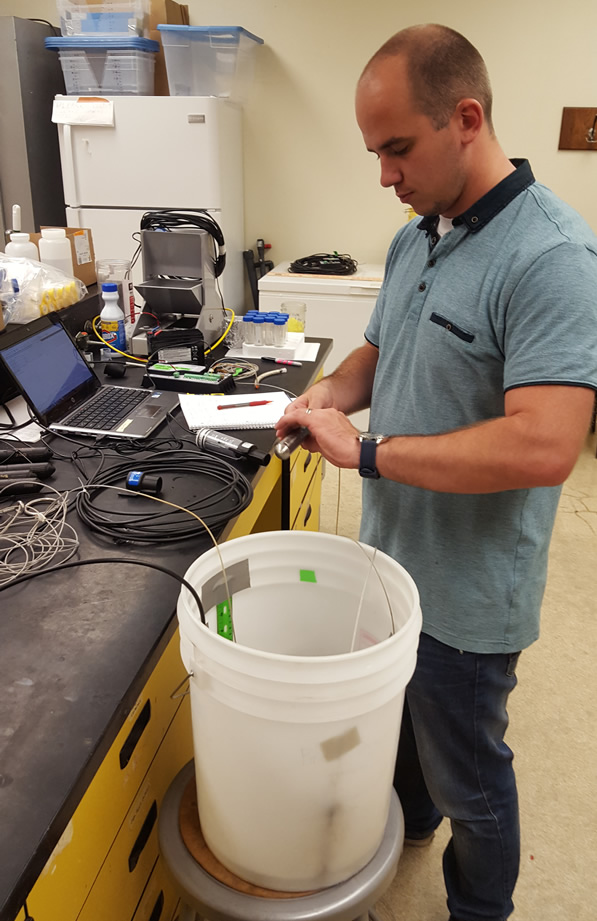
This week we ran some more tests on the V-Notched weir to calibrate and see what design works best. Tested all of our pressure transducers to see which ones were the most accurate in depth measurement. Also helped proses some water samples from a parking lot in SLC.
Collecting data/testing pressure transducer in bucket to find how much we need to curve data tested from V-notch weir.
Running test on V-Notched weir to calibrate the depth and flow rate.
Shanae Tate
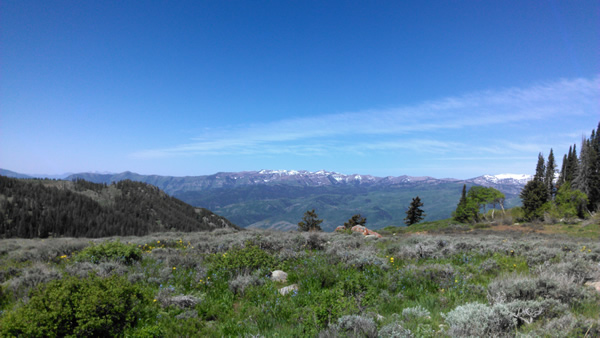
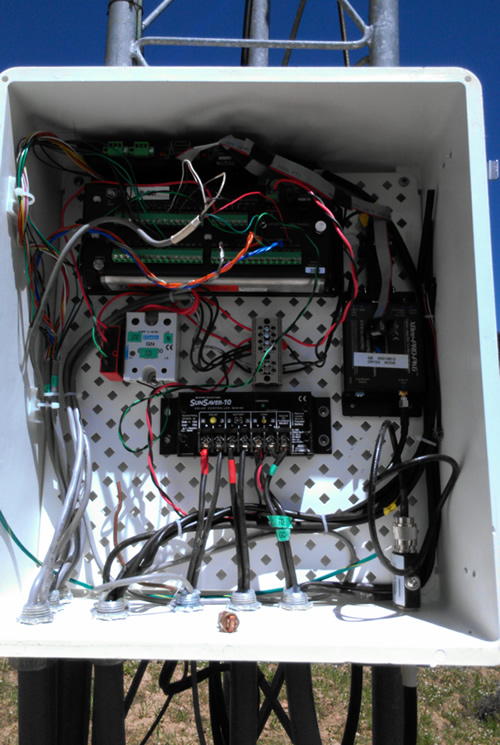
The Cohort Session on Monday helped me practice talking about my research to people with varying backgrounds and interests. I also enjoyed our field trip where we learned how to do on-site sulfate tests and filtered sampling. On Wednesday Jobie and I went to the T. W. Daniels Experimental Forest Site for a lesson in Data Loggers 101. I hope to become very familiar with all of this GAMUT instrumentation. There are so many climate stations and sensors set up at that site. I saw my first SNOTEL site and saw some glorious lysimeters. Understanding the instruments that collect and log measurements helps me to appreciate the data I analyze.
This is the view from the TWDEF Site in Logan Canyon.
Sneak peak at the data loggers.
Luis Vidal
This was a great week of results and community involvement. The week started off with an iFellows cohort session in which we went over presenting our research topics and receiving feedback for the first parts of our paper. Later in the week we went to the Glendale Community Council meeting were we met lots of civicly engaged residents. We got a great number of quality surveys at the meeting and a chance to speak. Later on Friday we surveyed at Smiths and Rancho market grocery stores. I lost my voice due to a sore throat but we still got great results at each location.
Lily Wetterlin
This week was a bit slower in the lab, isocamp has started up so much of our equipment has been taken due to that. I spent the week working on my paper and reading more papers in relation to my project. Our cohort session on Monday was very useful in practicing in presenting our research for the upcoming iFellow Symposium, we also got to work with some new equipment out in the field!
Adam Whalen
My week began with a cohort session down at BYU. This was my first time seeing the other iFellows in three weeks, which made for nice conversation on how our respective research was going. We began the day by reading each other’s introduction and methods portion of our posters, and the giving quick critiques in a “speed dating format”. Not only was this helpful for my own research, but it helped me see how other individuals were crafting their own posters. After that we made our way up the Provo canyon for some hands-on water sampling. I’m mostly locked up in an office for my research, so it was nice to get outside while still working on iUTAH projects. While the technical aspects of measuring E-Coli presence in the river were over my head, it was fun to see what other people are doing with their projects.
The remainder of the week was reserved for primarily more coding. I mainly clean the data, which involves isolating and identifying the variables that are relevant to my research. I hope to begin drawing up correlations and comparisons as soon as next week. Outside of the coding, I also worked on my poster presentation. Taking critiques from the other iFellows, I adjusted my introduction and methods section accordingly. Furthermore, I began to conceptualize what figures I will inevitably put on my poster. While I’ll have to wait and see what kind of data I end up with, there should be space for four to five figures on my poster.
Once again, there will be no cohort session next week so I will predominantly spend the time on my research. I hope to finish cleaning up my data and ultimately begin drawing up comparisons between data sets. It’s very exciting to see my research coming to fruition.
Testing for E-Coli presence in water samples!
Sandra Udy (Young)
This week began with a cohort session. This cohort session was a wonderful chance to get some hands on experience in presenting and in the field. I was extremely grateful for the presenting experience. Presenting a poster is very different than presenting a powerpoint. I liked that it gave me a chance to bounce ideas off of other iFellows and see how they outlined their poster so far. It also was a great experience to learn how to share what I learned to different audiences. I liked how we talked about getting to know the audience before we began to share with them. I also had the chance this week to start to learn about R. I worked with Beth Ogata to figure out what different lines of code mean for the output of graphs and charts. I still have a lot to learn but it was pretty exciting when I was able to produce a chart! Next week begins with fieldwork and collecting of the NDS cups we deployed earlier. I am excited to tie in all of the things I learned.
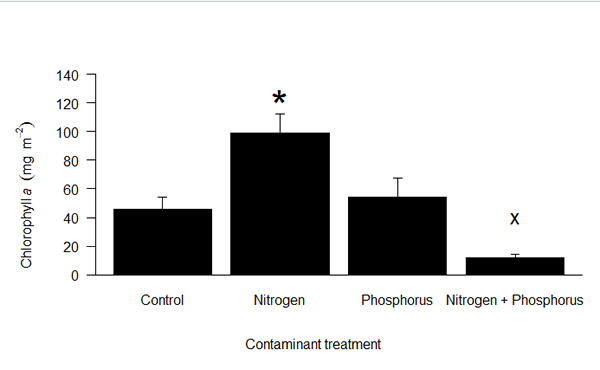
This chart was produced using R.
All content provided on this iUTAH Team - Undergraduate iFellows weekly recap is unedited, updated by each participant to provide a review of their progress, and is for informational purposes only.