iUTAH Team - Undergraduate iFellows
Shanae Tate
Brigham Young University
Mentors:
Faculty: Scott Jones, USU
Graduate: Kay Parajuli, USU
Research Focus:
Research Focus Area 1
Major:
Environmental Science
Biography:
Shanae is a Senior at BYU majoring in Environmental Science and minoring in Math. She loves soil and water. She plans on restoring watersheds after finishing graduate school. Her favorite activities are playing Frisbee and recycling. She also enjoys riding bikes, running, dancing, singing, and hypothesizing about plants.
iFellow Presentation:
The Effects of Elevation on Evapotranspiration
Presented by: Shanae Tate
July 2016
Weekly Recap:
Week 1 | Week 2 | Week 3 | Week 4 | Week 5 | Week 6 | Week 7 | Week 8 | Week 9 | Week 10 | Week 11
Week 1: May 16-20, 2016
This week has been full of learning and adjusting. I have been reviewing lots of equations and concepts dealing with soil physics. This has helped me learn how the sensors work and solidify my knowledge of what the data coming from those sensors represents. Chris took me to see some of the aquatic sites in the Logan Watershed. There I learned that the iUTAH data are sent via radio waves to the various universities. I also learned about different instruments that measure stream flow. I am excited to continue visiting these sites and learning about the data that they provide.
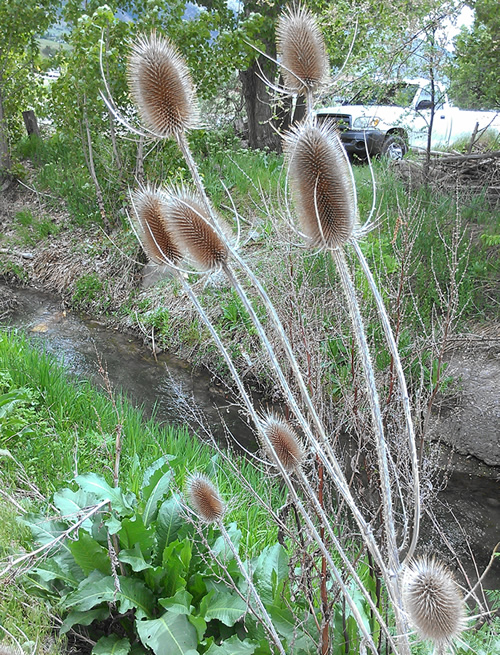
We hiked through many thistles and other pokey plants to get to an aquatic site
Week 2: May 23-27, 2016
It has been a great week here in the Soils Department at Utah State.
I have learned about the Water Retention Curve, which is also known as the Soil Water Characteristic. This is essentially the basis of all of soil physics, but I didn't realize it was that essential for everything in this field. It describes the relationship between water content and energy.
I'm super glad we talked about data management in our Cohort Session on Monday. I've dealt with a lot of data this week from our water retention curve experiment and also from the GAMUT soil moisture sensors. We are strategizing a plan for the re-calibration of the soil water content sensors and trying to find the shift that occurred with a firmware update last fall. I have learned a lot about organizing data and I believe there is a great future in data management ahead of me.
In other news, Chris and I took some flow measurements at the aquatic sites on Main Street. We basically lowered a 75-pound hunk of metal shaped like a torpedo into the water. The torpedo was so heavy so that it stayed in place in the water, allowing the sensor to measure the velocity of the river. The velocity and the other measurements we took will be used to calculate the discharge of the river.
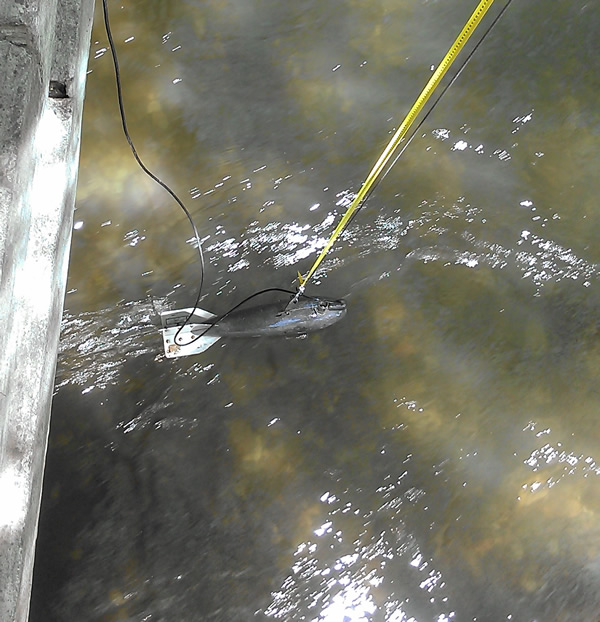
This torpedo-looking anvil was the tool we lowered into the Logan River in order to measure the velocity of the water at certain depths.
Week 3: May 30-June 3, 2016
I am getting better at managing data and using Excel for plotting data and fitting curves to them. I am also learning to recognize the shift that occurred in the data with the firmware update in the soil moisture sensors. I enjoy learning from the soil physics manual as I do calculations and practice problems. I have also been reviewing literature about estimating evapotranspiration using a water budget and soil moisture data.
Week 4: June 6-10, 2016
It's been a busy week as I've determined where most of the shifts occurred in the soil moisture data using Loggernet, a program from Campbell Scientific. With this information we are on our way to the next step, which is to calculate the new calibration constants! I've also been rewriting my prospectus, introduction, and methods and have learned even more about soil-water relations.
On Friday I went with Hyrum and Dave to take the discharge measurements at the Franklin Basin, Tony Grove, and Water Lab Aquatic Sites. There is much to be learned about these sites, so stay tuned!
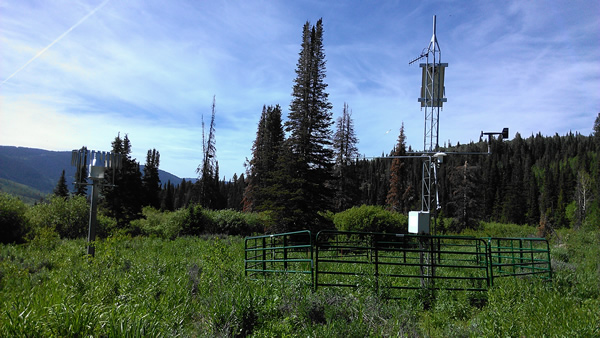
Climate Station at Franklin Basin
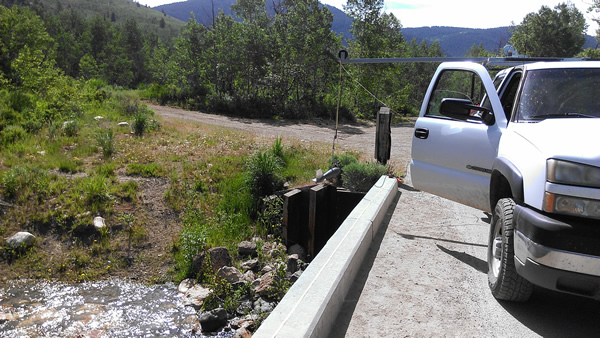
Taking the discharge measurements with our trusty truck and torpedo
Week 5: June 13-17, 2016
The Cohort Session on Monday helped me practice talking about my research to people with varying backgrounds and interests. I also enjoyed our field trip where we learned how to do on-site sulfate tests and filtered sampling. On Wednesday Jobie and I went to the T. W. Daniels Experimental Forest Site for a lesson in Data Loggers 101. I hope to become very familiar with all of this GAMUT instrumentation. There are so many climate stations and sensors set up at that site. I saw my first SNOTEL site and saw some glorious lysimeters. Understanding the instruments that collect and log measurements helps me to appreciate the data I analyze.
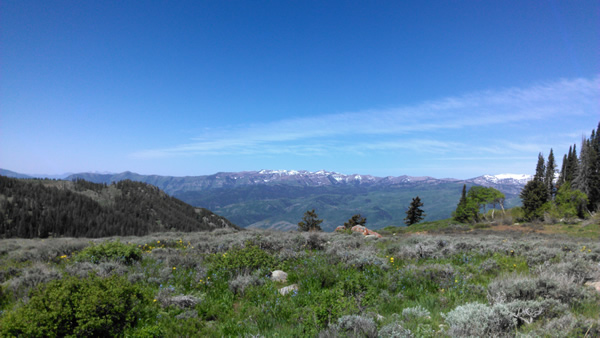
This is the view from the TWDEF Site in Logan Canyon.
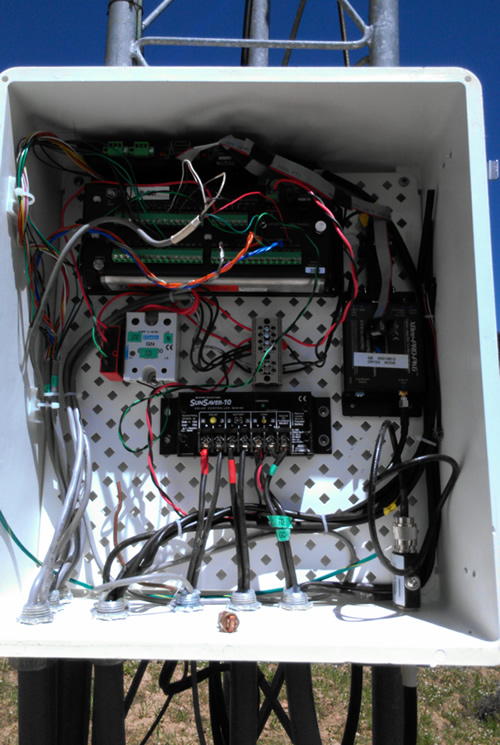
Sneak peak at the data loggers.
Week 6: June 20-24, 2016
This week I went with John and Thomas to TWDEF to put up the fence to keep the livestock out of the study site. Most of the remaining time was spent with my good friend Microsoft Excel. I have been making all sorts of graphs, cleaning up the data, and trying to make my water balance calculations work.
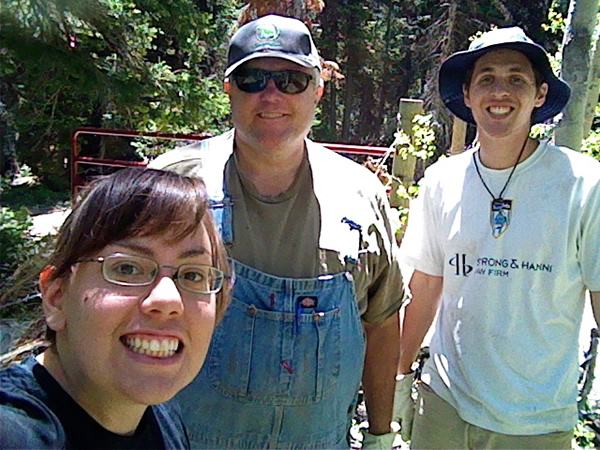
The fencing crew
Week 7: June 27-July 1, 2016
Time is flying by and we've already finished the 7th week of the program! That means that it's time to crack down on my paper and preparing a draft of my poster. We'll present our posters next week for practice. On Thursday I went once again with Chris and Kay to our famous TWDEF site. There we replaced a few Acclima TDT probes that measure soil water content. Kay also took some soil water measurements with the neutron scattering probe. I've read loads about neutron scattering, but I'd never seen it in action, so that was excellent. Learning is fun!
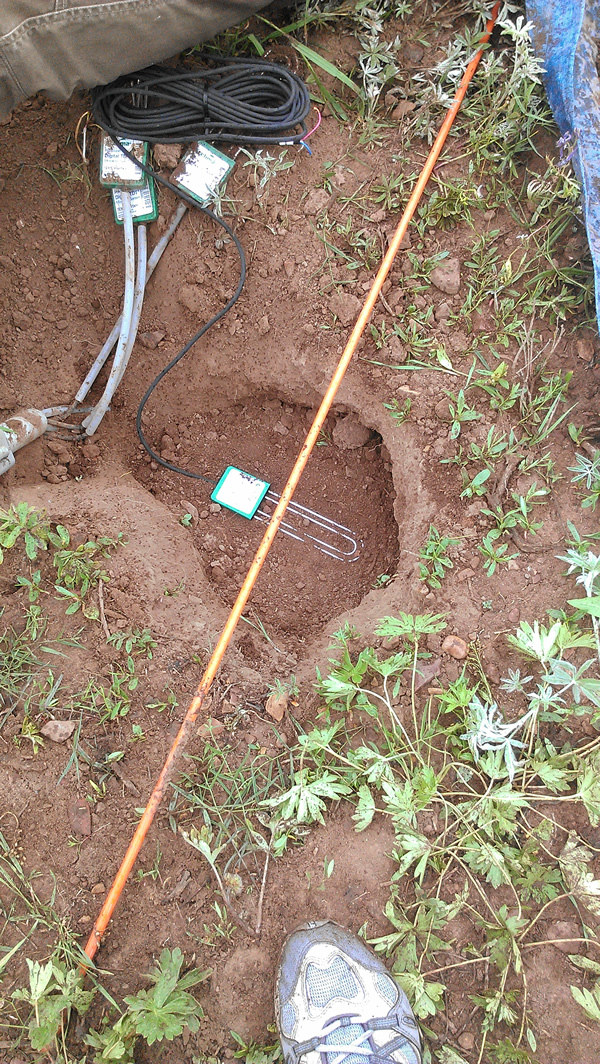
Pictured is an Acclima TDT soil moisture sensor that we installed at 20 cm depth in the soil profile
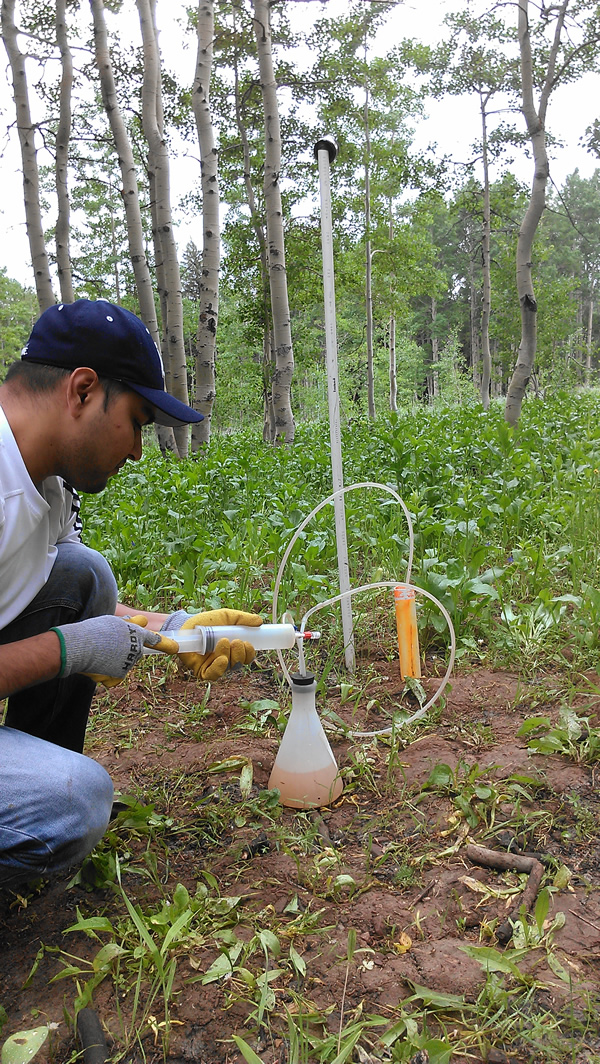
Kay, my mentor, pumps water out of the access tube so that we can take the measurements with the neutron scattering probe
Pumping out water from the access tube for the neutron scattering probe.
Week 8: July 4-8, 2016
It's been a short, but good week here. I've spent most of my time trying to create results to show on my poster. I made the draft and I'm really glad I received such useful feedback today at our Cohort Session. There's a lot to do still before the symposium and I need to practice my "elevator pitch."
Week 9: July 11-15, 2016
I successfully made a poster and presented it during the poster session at the iUTAH Symposium! I am glad that I could have that experience. I was so nervous, but it ended up not being so scary after all. I enjoyed conversing with people who have similar interests as I have and who gave me more ideas for the analysis of my data. I pretty much felt like the queen of the world after making my poster and presenting it because it was something new and challenging.
Week 10: July 18-22, 2016
This week I have been able to do more analysis of the data. This has allowed me to draw more conclusions and write my paper. We are preparing to wrap things up for the season with our research paper and presentation next week. It's a great and busy time to be an iFellow!
Week 11: July 25-29, 2016
iFellow Shanae Tate explains volumetric water content.
All content provided on this iUTAH Team - Undergraduate iFellows weekly recap is unedited, updated by each participant to provide a review of their progress, and is for informational purposes only.