This site is being archived for historical purposes. The information contained within may no longer be accurate or up-to-date. Please note that the content of this page is no longer actively maintained and may not reflect current information.
innovative Urban Transitions and Aridregion Hydro-sustainability
iUTAH Undergraduate iFellows
Week 7 Recap
June 26-30, 2017
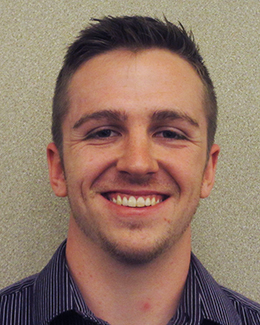
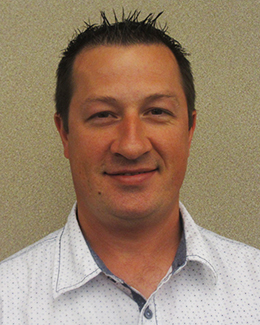
Chase Beyer
Not a whole lot went on this week that directly relates to my project. What we did do was put a tipping bucket in the bottom of the sump at the Engineering collection site, so we can have an auto sampler sample roof drainage directly. We also replaced a couple dead batteries and collected minor samples from the pump house roof and the 6-foot well at Engineering. The Green Meadows site also got some much needed weeding in the bays and some sunflower plants were transplanted in, since the sprout rate of the seeds was not so great. Thursday evening I also went to Bear Lake to grab some shakes with some other iFellows, Jared, Emily, and Chris. We planned on playing spike ball, but couldn't really find a spot to play and it got cold really quickly when the sun went down, so our visit was really brief. That's it for this week! Next week I have to simulate some rainfall for more data and wrap up my poster!
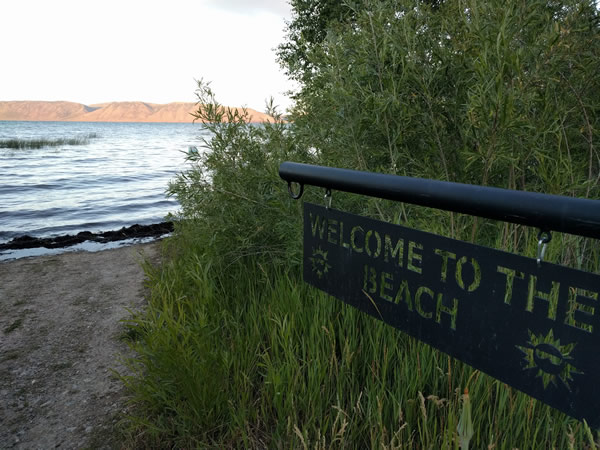
Bear Lake and the sign referencing the now underwater beach.
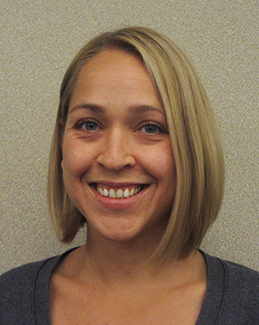
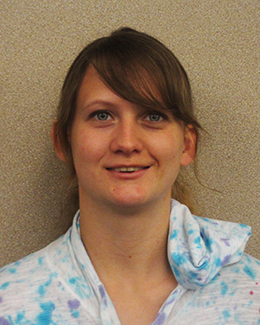
Lindsay Capito
This week we spent more time on putting the data we have collected into a more manageable format and running statistics. One day was spent matching up field sites to the gis model in order to run statistics. Wednesday, we had a very productive lab meeting and I received lots of great feedback on my ideas for how to graphically represent the data. Thursday, we hit some sites in Ogden valley that had previously been too high to measure then ended the day with a lab BBQ at Dr. Nulls house. It was nice to spend time with our lab mates outside of work. It feels like things are starting to really come together but I have to say I’m sad to be winding down field work!
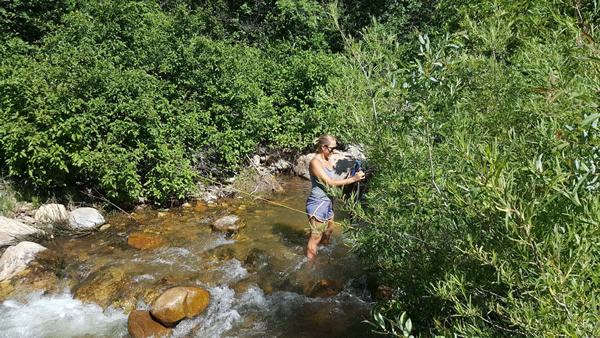
Measuring discharge near Powder Mountain Ski Resort.
Maggie England
Last week Andy and I worked on data analyses for what we found during field work. We met with Susan Durham to consult on our analysis, and worked on some exploratory data modeling.
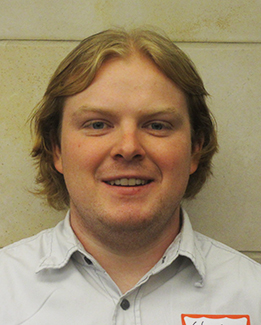
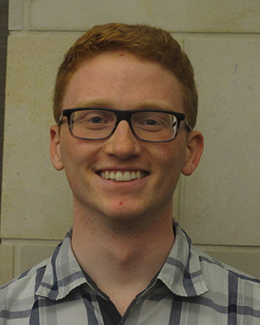
Christian Ford
This week has been a successful one. I have made a lot of ground on my poster. On Wednesdays we have a research group meeting with my Mentor, Dr. Rosenberg and his Master Students and my near-peer Mentor Jim Stagge. During this meeting we went over graphs and how to accurately and appropriately show the data you collect. I was able to get valuable and useful feed back on the graph I was gong to use for my poster. I am now much more confident with what I will have to share at he next cohort meeting. Improving the visual aspect of my poster enabled my writing in my conclusion to be more clear and concise. I will still have work to do with the feedback I will receive next week from the two sessions I will have to practice and receive feedback on my poster presentation next week.
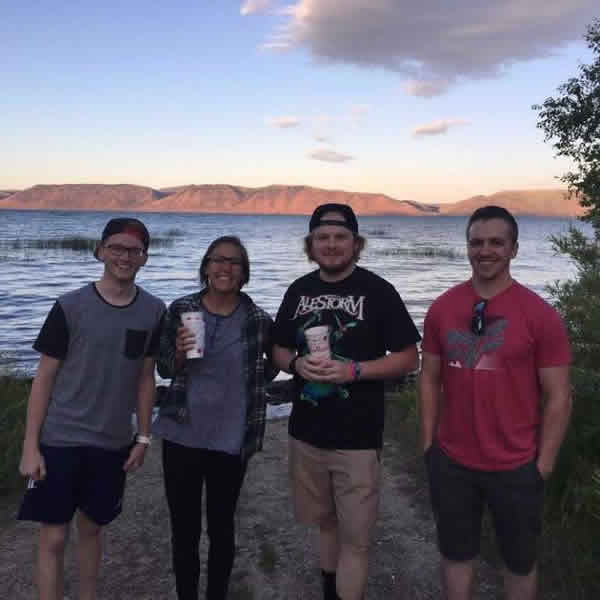
Some other fun news... one night this week me and some other iFellows in Logan took a trip through the canyon and visited Bear Lake! It was fun to see the massive water collection, now knowing how big of a roll it plays in the Bear River water system and my life. Also, the raspberry shakes are to drive for! ;)
iFellows (left to right) Jared Stewart, Emily Jorgensen, Chris Ford, and Chase Beyer enjoy famous Bear Lake Raspberry shakes in Garden City, UT.
Michael Fowles
This week I worked with data we have been collecting in the field over the past several weeks. Using both elevation and stream order, I was able to graph data to see if there was any correlation between stream habitat quality and where in the watershed it was located.
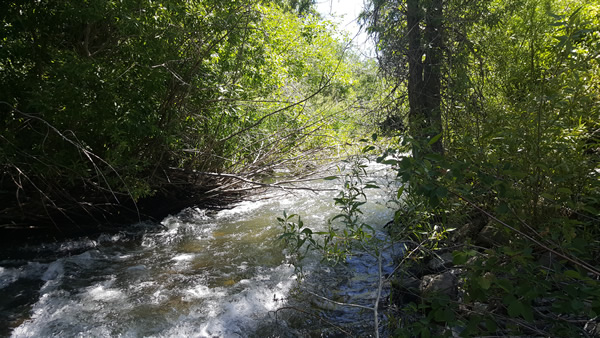
We were also able to get one day in the field. We focused on several tributaries to the Ogden River on the northern side of the Ogden Valley which will help spatially round off our data collection sites within the Weber Basin watershed.
North fork Ogden River
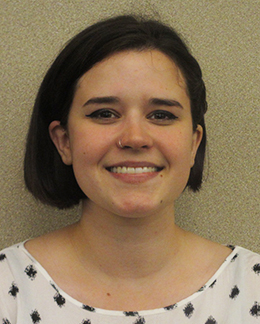
Emily Jorgensen
This week I officially finished gathering all the data that I needed after having to redo one of sampling blocks. My near peer mentor was able to help me start learning how to code using the program R. Although some of the coding was tedious, it’s been exciting to actually see some results and trends with the data I’ve collected over the last month. The rest of the week was spent analyzing the data and creating table and graphs to represent these patterns and get them ready for my poster. I also was able to hang out with other iFellows and take a quick trip out to Bear Lake for some raspberry shakes which was another highlight of the week!
Andrew Luymes
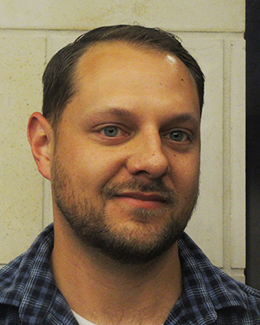
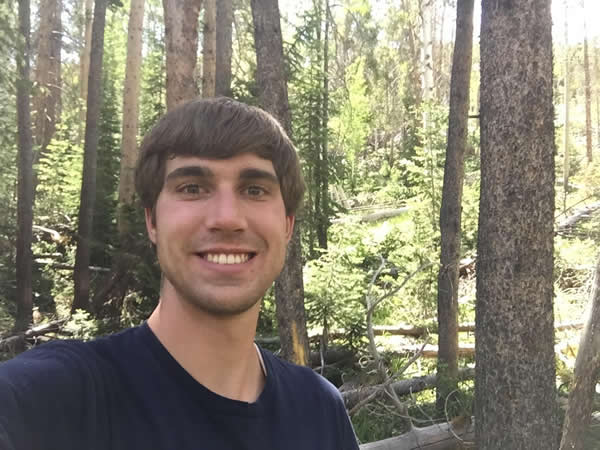
This week is the start of my own project. On Monday I woke up at 6am, and left on my own for the Upper Provo River. Starting at the Soapstone campsite and hitting 20 different sample sites all over the watershed. I didn't get back home till 11:30pm. It was an exhausting day doing all the work on my own.
My project, I have been tasked with taking soil samples through out the Upper Provo River Watershed, and testing the soil for spatial variations that will hopefully give us insight into specific areas of the watershed that we can focus on for future work. Dr. Carling and his grad students are interested in mercury and strontium as they cycle and interact with the ecosystem. By increasing our knowledge of the soil characteristics of the watershed, we hope to gain insight into areas where there are increased concentrations of these trace metals.
Not a glamorous photo of me, but this was taken at about the half way point. At this time, I had already been working for about 8 hours.
Rosanise Odell
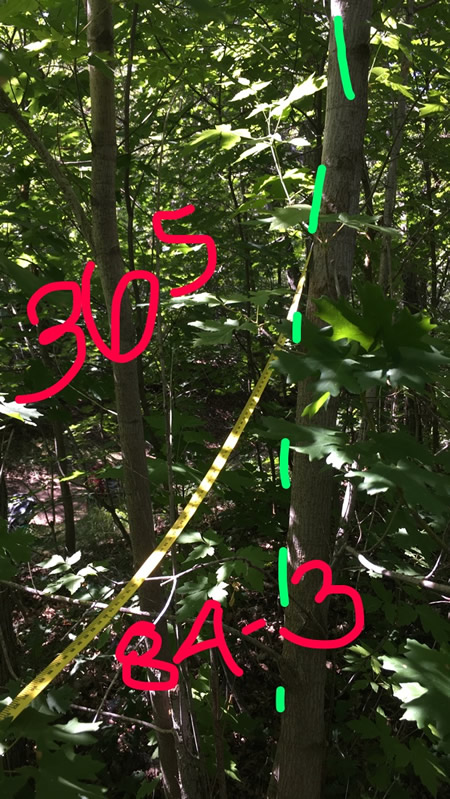
This week I finished up calculating the competition index for the trees I’m studying. Then, I went out to Red Butte Garden to take my first measurements with the LiCor—it seemed like a big deal to take the instrument out myself and make sure all the settings and conditions were correct, and then to finally get some of my own original data. We also started a second round of daytime stomatal conductance measurements for another ongoing project in the lab. I spent a fair amount of time working with R Studio to create figures of the data I already have from the experiment last fall, and learned some new commands from the new post-doc in the lab, Anna. I’m feeling more confident than before with using R to analyze data, and am excited to see what figures I’ll end up with for my poster presentation.
I used Snapchat to help me mark and remember trees while I was calculating
the competition index for individuals in similar areas. This method was actually quite useful.
Gabrielle Regenhardt
No entry
Agatha Roese
This week was a tough week. I got really sick on Monday and couldn’t work on Tuesday. So when I came back we were a little behind on running phosphorous tests. But now that we understand what we are doing, we run it a lot faster and easier. They sampled on Wednesday and Thursday and we were able to run dissolved reactive phosphorous and total reactive phosphorous on both the days. Which is really good because those are time sensitive and should be done as soon as the samples are in the lab. On Thursday I also got to make agar and plate samples for the first time while I have been here. I was here until eight o’clock at night just plates and making sure to get the sample in the right plates and I am really excited to see if something will grow on the plates I made.
Eric Shipp
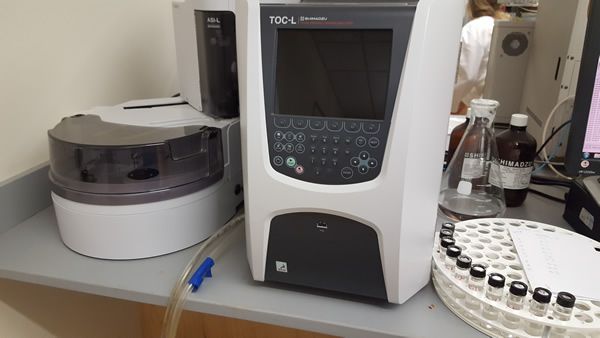
Our team had the opportunity to take some of our samples, and run them on the total organic carbon analyzer in the Environmental Analytical Laboratory on campus. It’s very interesting to learn how to use these highly sophisticated and accurate systems to measure different nutrients in our water. We are also running more of our samples on the spectrophotometer to measure the amount of phosphorus in our filtered and non-filtered water samples. This is a fun but short week due to the holiday and the cohort session.
TOC Analyzer we are using
Jared Stewart
This week I really started to analyze my data. It has been interesting to note the language and communication differences between automated tweets and uniquely crafted tweets. Most tweets that NWS offices automate come in English and Spanish. A big Kudos for the El Paso and Albuquerque Weather Forecasting Offices (WFO’s) for their excellent work in multi-lingual tweets! Other offices still have some work to do…
I’ve learned this week how much I still need to learn. Statistics is a field I just haven’t worked in much, and thus have little expertise. Also there is a massive amount of literature on risk perception that I could spend time reading. I did get to spend a few hours this week reading Environmental Hazards by Keith Smith. Shout out to Dr. Howe for lending me this and other excellent reads.
I came up against two small hiccups this week too. First, I realized that I had a hole in my data for the Miami WFO. When I added the tweets from Miami I had forgotten to filter/search for two words. Once I did I had an extra ~100 tweets to gather data from. It took an extra hour or two but I got the new stuff all incorporated! Second, when calculating the total population served by each WFO, I found that some counties were split in unusual ways between two or even three WFO’s. Allocating the population between these accurately was a huge task because it could take significant time to find county specific population data and then decipher where to cut the counties. At the suggestion of my near peer mentor I decided to split them evenly between each applicable WFO. This may not have been perfectly accurate, but it’s the best I can do with the time I have. I can also make it clear in any literature I produce that it only affected the population count of three WFO’s and probably not to any huge extent.
Arin Towns
This week we were able to get a lot of our data digitized, meaning we can finally really look for data trends. Also, we were able to identify anomalous data and return to the sample sites to try and determine the cause.
Conor Tyson
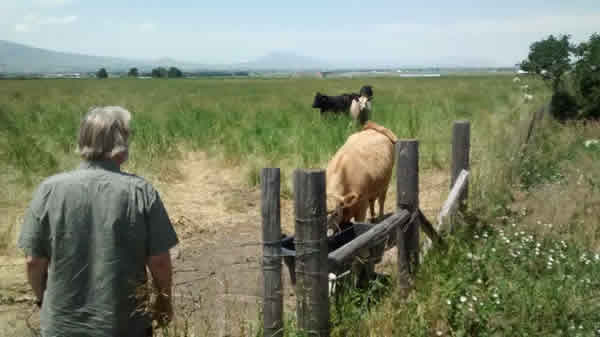
On Monday I again went out to help collect groundwater samples near the landfill. The water table is much lower and the resulting water was dirtier. That afternoon I did biosolid tests for BOD to determine how the BOD machine operates. On Tuesday we had a little bit of rain so I went with Chase to collect what rainfall samples we could and to process them. Despite having only two samples it still took awhile to do all the process. On Thursday we installed more samplers for collecting rainfall. On Friday we went to a site with plants and transplanted lots of sunflowers. Also, we had a meeting and a more detailed description of how we are setting up my project was discussed. We are hopeful we can get it started on Wednesday so I can have data for my poster.
Dr Dupont observing the field where the irrigation study will take place.
Desiree Wickwar
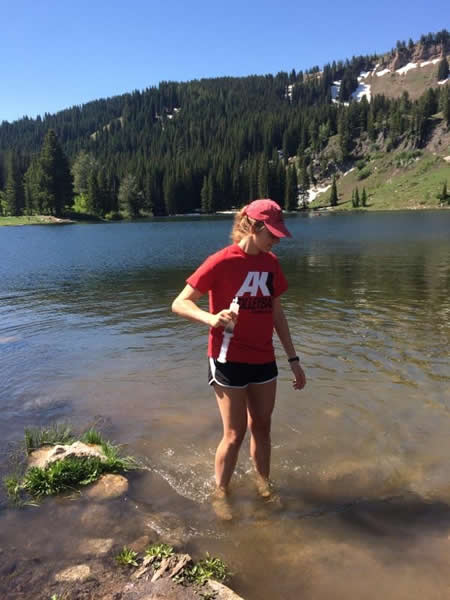
This week I went out and took dissolved gas samples from various bodies of water near Logan, and ambient air samples from around them. In doing so I got to examine the differences in the chemical, geological and biological traits of aquatic systems that determine if the greenhouse gases in the water and in the air are in equilibrium, or if they are not, the degree to which each body of water was an emitter of greenhouse gases. It was interesting to try to apply some of what I have learned and read about to systems in the field, and I feel as though it has been an important step in helping me understand the material better.
Taking dissolved gas samples
All content provided on this iUTAH Team - Undergraduate iFellows weekly recap is unedited, updated by each participant to provide a review of their progress, and is for informational purposes only.