iUTAH Team - Undergraduate iFellows

Arin Towns
Utah State University
Mentors:
Faculty: Janice Brahney, USU
Faculty: Bethany Neilson, USU
Near-Peer: None
Research Focus:
Research Focus Area 1
Project: Didymosphenia in the Logan River
Major:
Environmental Engineering
Biography:
Arin Towns is working towards an undergraduate degree in environmental engineering from Utah State University. She hopes to focus on sustainable energy and eventually pursue a master’s degree in sustainable architecture. Outside of her studies, she enjoys drawing, painting, and being outdoors. She expects to learn a lot as an iFellow and is very pleased to have this opportunity.
Research Abstract:
Effects of beaver dams on stream biogeochemistryThe biogeochemical and ecological effects of beaver dams are expansive and at present not well understood. This study is designed to understand the physical and biogeochemical effects beaver dams may have on river water and stream bed composition. We tested potential beaver dam effects by comparing longitudinal stream profiles from two streams in Cache County Utah; Curtis Creek, a stream with deconstructing beaver dams, and Spawn Creek, a stream with active beaver dams. Data collected at each site included physical characteristics of the water column (pH, specific conductivity, temperature, dissolved oxygen, and turbidity), biogeochemical characteristics of the water column (total phosphorous and nitrogen, dissolved organic carbon), and periphyton and sediment analyses for ash-free dry mass (AFDM) and Chlorophyll-a as proxies for productivity. We sampled upstream, within, and downstream of several active or deconstructing beaver dams along each river, each week through the spring season therefore our data represents both longitudinal stream gradients and changes through time. Although some sample testing and data analysis are in preliminary stages, we have found interesting patterns based on the physical data. In general, Curtis creeks shows linear trends through the longitudinal sections while Spawn creek is more varied, likely due to the stream complexity attributable to beaver dams. One trend that is statistically significant is the percent dissolved oxygen in dam sites, which is higher than sites right below the dams (p< 0.042). We found many noticeable trends (particularly in temperature and turbidity) that need more data sets in order to be statistically significant. These patterns could become the foundation for future, more expansive studies.
Weekly Recap:
Week 1 | Week 2 | Week 3 | Week 4 | Week 5 | Week 6 | Week 7 | Week 8 | Week 9 | Week 10 | Week 11
Week 1: May 15-21, 2017
This week, my mentor had pressing business out of town. Keeping in touch, she instructed me to prepare sample collection procedures. We intend to test water conditions including Chlorophyll-a, Ash Free Dry Mass, Dissolved organic carbon, nutrients, TP, TN, pH, and Alkalinity. I have spent the week researching and preparing these procedures, I am very excited to dive into the field and lab work next week.
Week 2: May 22-28, 2017
The majority of this week was spent in research and finalizing sample collecting protocols. Friday we hiked to two rivers and took our first samples for testing. Testing begins next week.
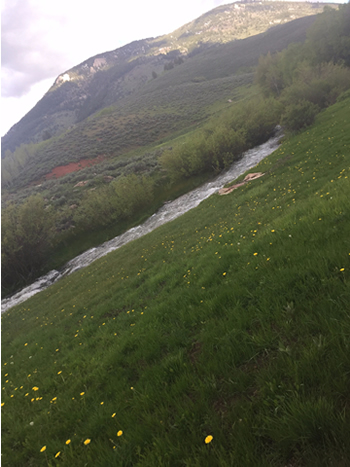
Spawn Creek
Week 3: May 29-June 2, 2017
This week was mostly more hiking to collect samples from the rivers. I also began training in the lab. I'm looking forward to where this project is going. Here's a picture of one of the beaver dams we are studying.
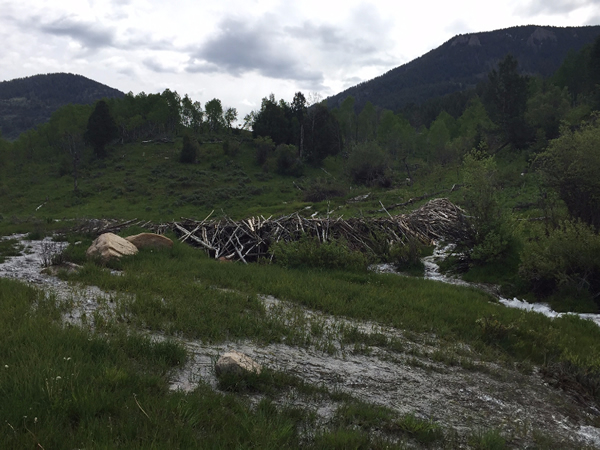
Beaver dam involved in study
Week 4: June 5-9, 2017
This week my team decided not to sample at the rivers. All week was spent filtering samples and training at the Utah Water Research lab. We resume sampling Monday of next week. I can't wait to fully understand the testing processes in the weeks to come.
Week 5: June 12-17, 2017
Both in the lab and in the field, a lot of work was accomplished this week. We sampled both river sites and performed multiple tests on instruments in the Utah Water Research Laboratory. It's still too early to see real results, but within the next few weeks we will know if our hypothesis is correct. Here is a picture of a tree affected by the beaver population.
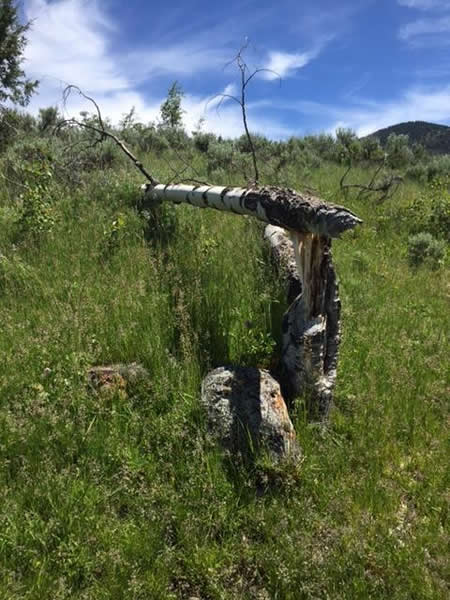
Tree affected by the beaver population.
Week 6: June 19-23, 2017
This week was pretty busy, we focused mainly on continuing sample collection and catching up on filtering samples. We also met as a team to discuss how the project is going and perfect our procedures.
Week 7: June 26-30, 2017
This week we were able to get a lot of our data digitized, meaning we can finally really look for data trends. Also, we were able to identify anomalous data and return to the sample sites to try and determine the cause.
Week 8: July 3-7, 2017
started to really analyze the data we have so far. There are already a few patterns emerging, hopefully there are more to come!
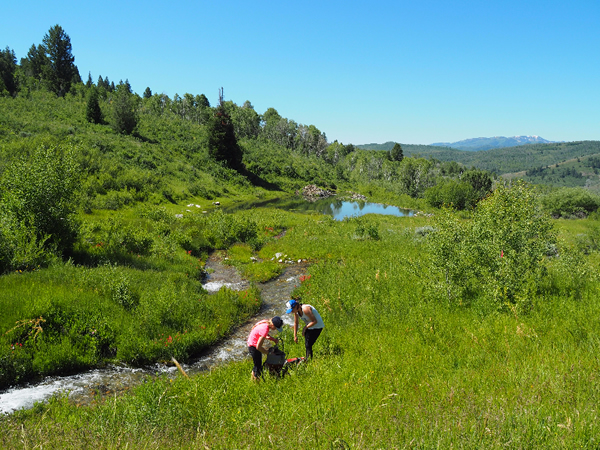
Me and Nikki Quinney (employee of the UWRL) at Spawn Creek
Week 9: July 10-14, 2017
This week was spent preparing for and attending the poster presentations at the iUtah symposium. I was able to analyze most of the data and found two statistically significant patterns, which was awesome. I am excited to start focusing on some background research over the next few weeks and begin creating an extended abstract and power point presentation.
Week 10: July 17-21, 2017
This week was busy. We completely finished filtering all water column samples and began the final data analysis for the project. We found some new statistically significant results with the new data. I also began working on my 10 minute powerpoint presentation.
Week 11: July 24-28, 2017
No entry
All content provided on this iUTAH Team - Undergraduate iFellows weekly recap is unedited, updated by each participant to provide a review of their progress, and is for informational purposes only.
